An innovative visualization also for energy efficiency class and PV electricity generation
Two birds with one stone
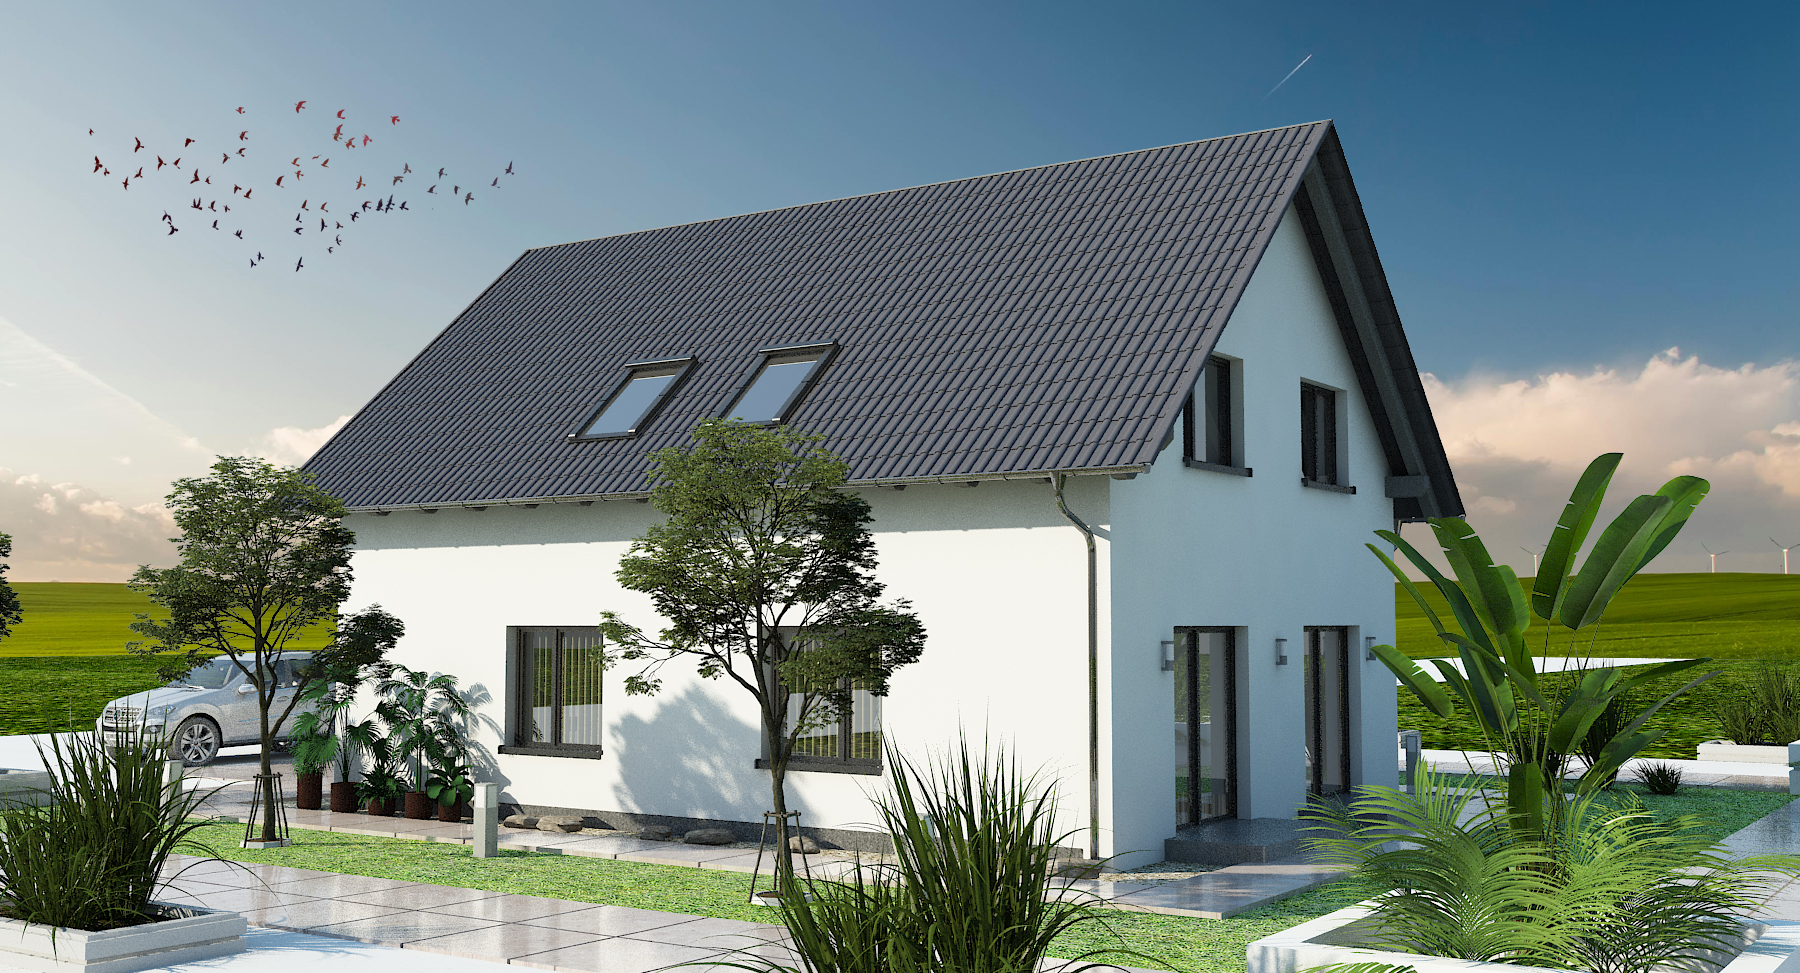
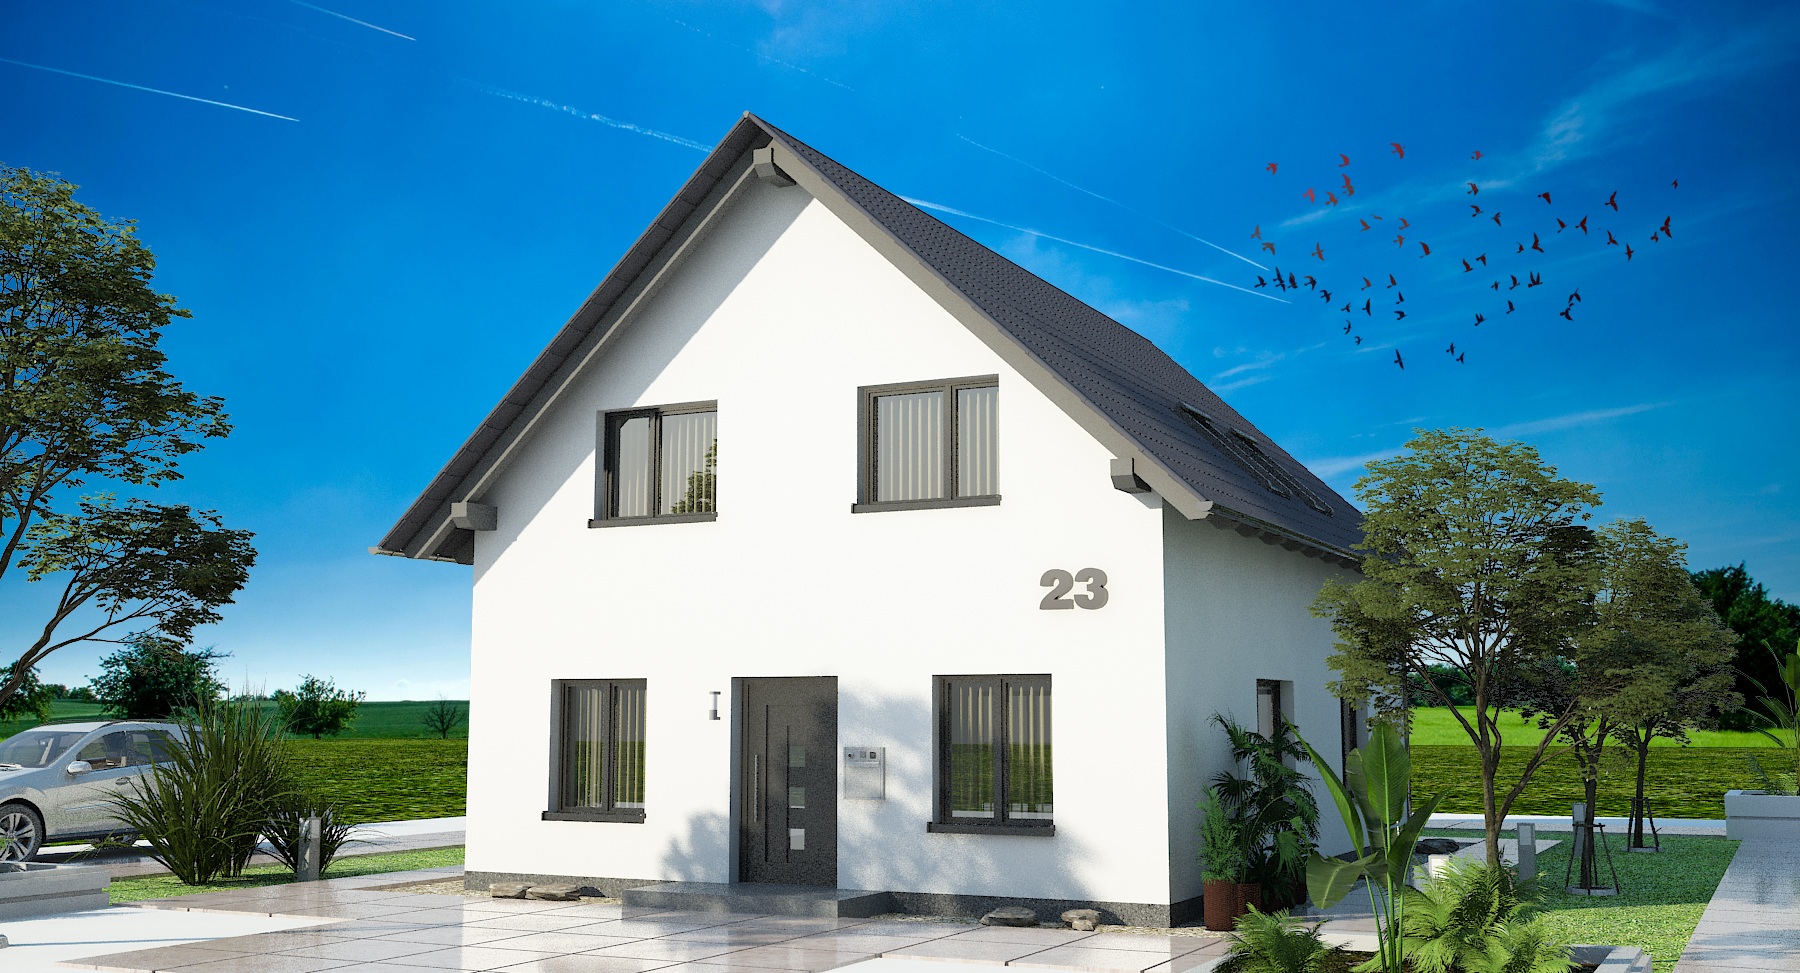
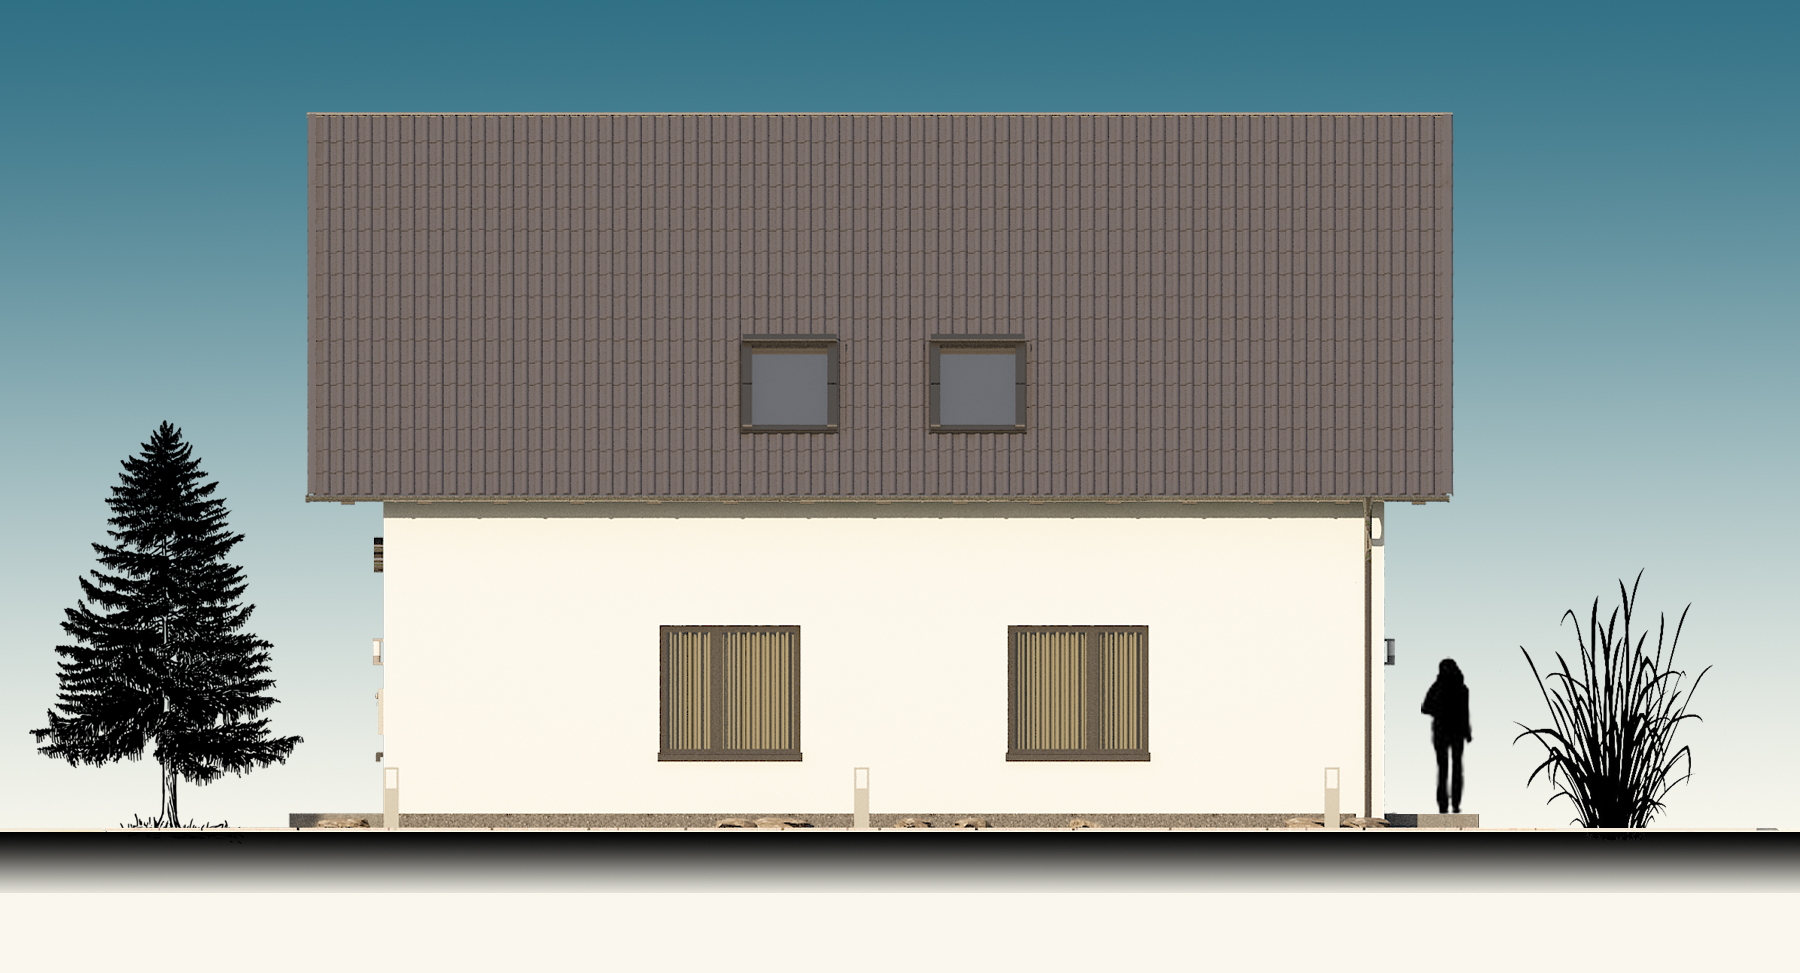
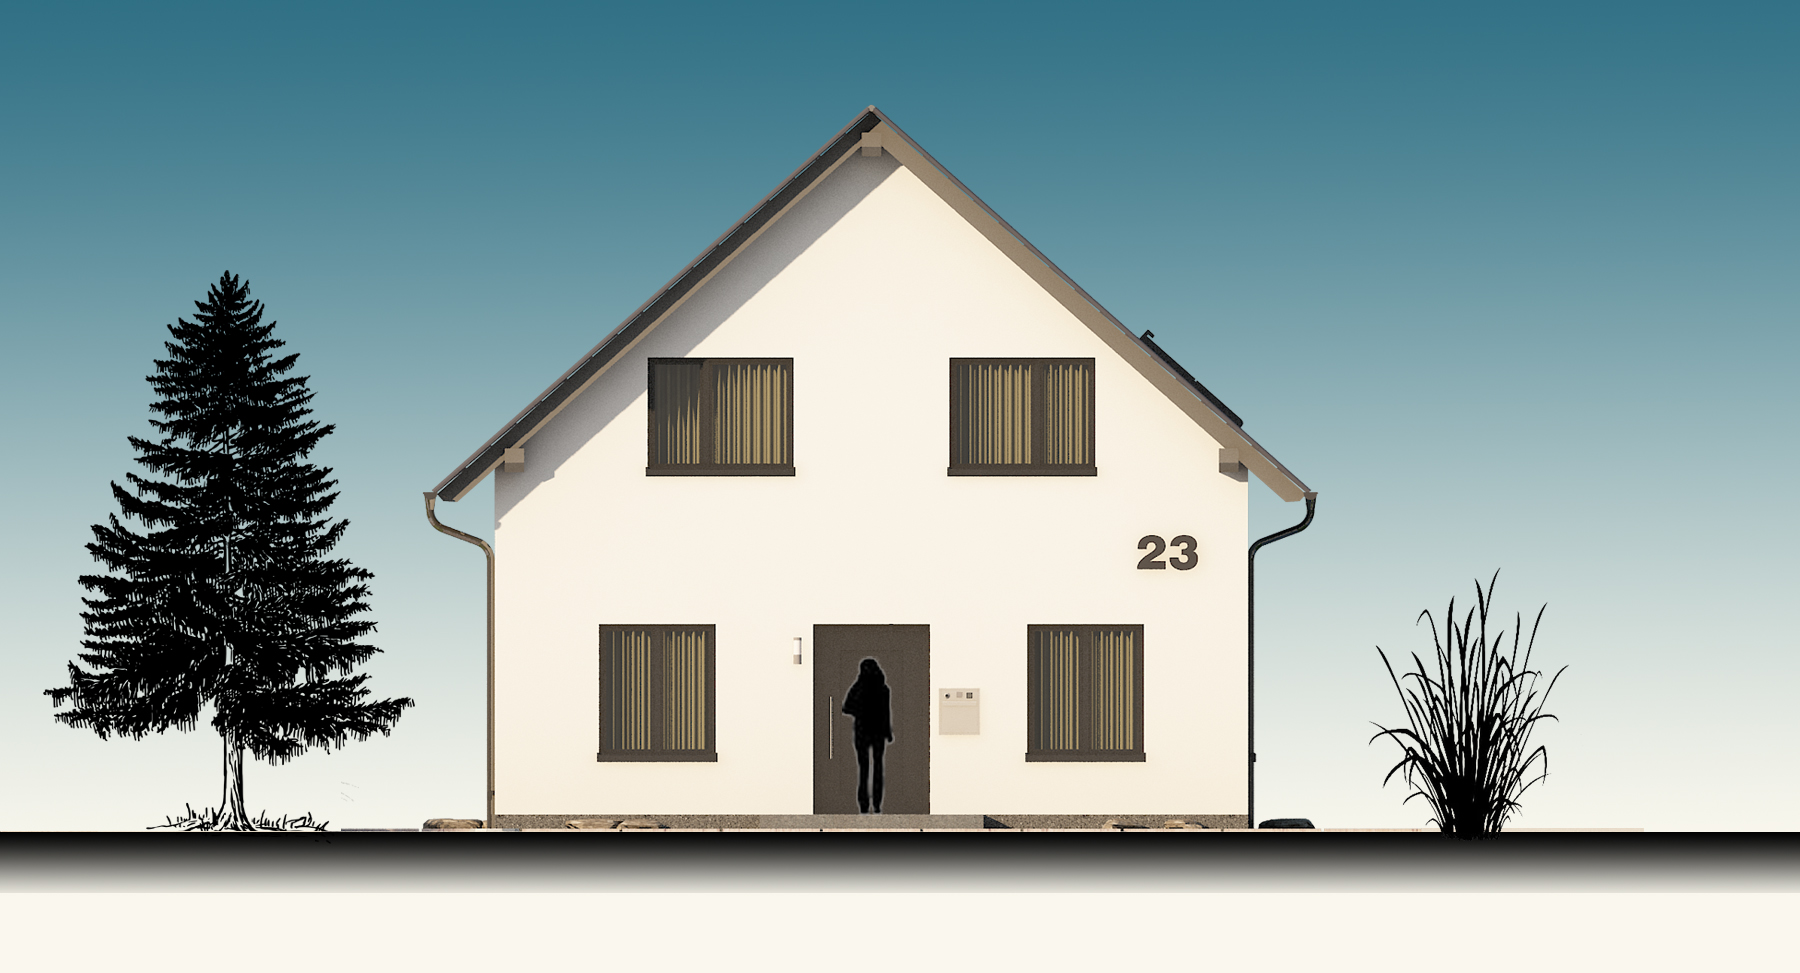
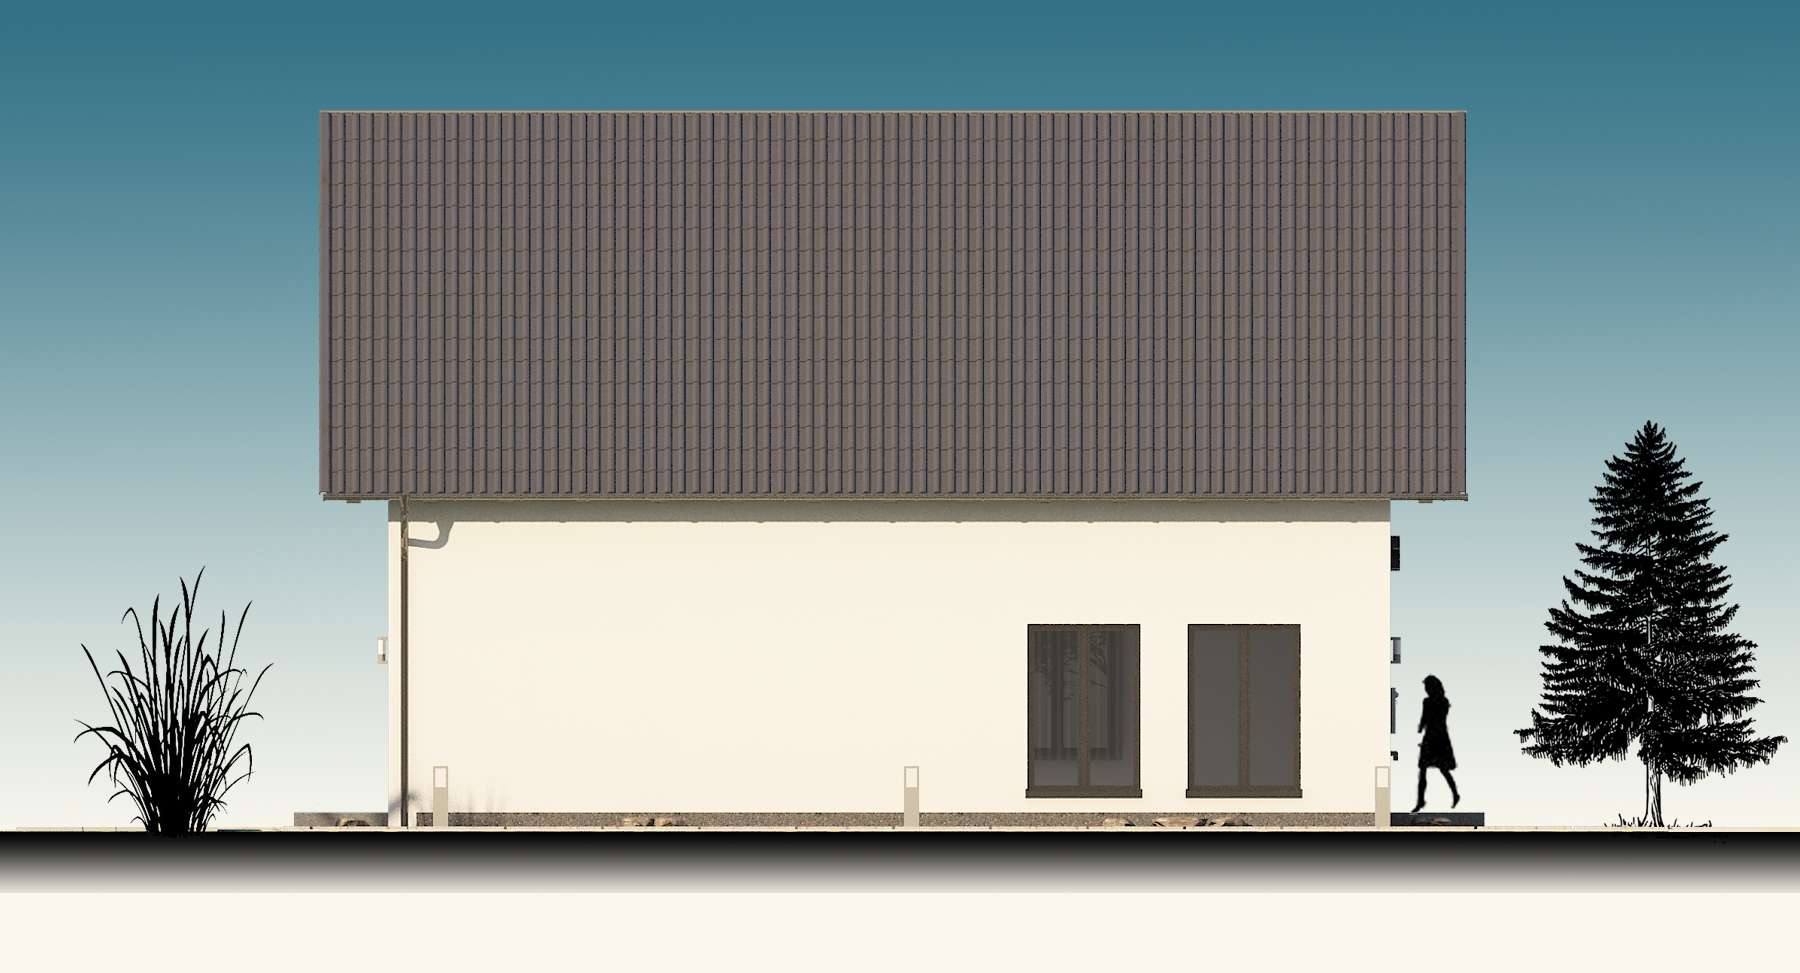
Through geometry visualization, the same 3D architectural data can be used to predict heating energy demand and PV electricity generation based on selected building materials, as well as the capacity and area of the photovoltaic system. In Evisuell+, this provides both a view of the 3D visualizations of the building and a guideline for the energy efficiency class simultaneously. As an example, a two-story single-family house with a south-north gable roof was visualized and simulated. The four main services of Visuell+ are presented below in order of their delivery and content.
1. Visualization
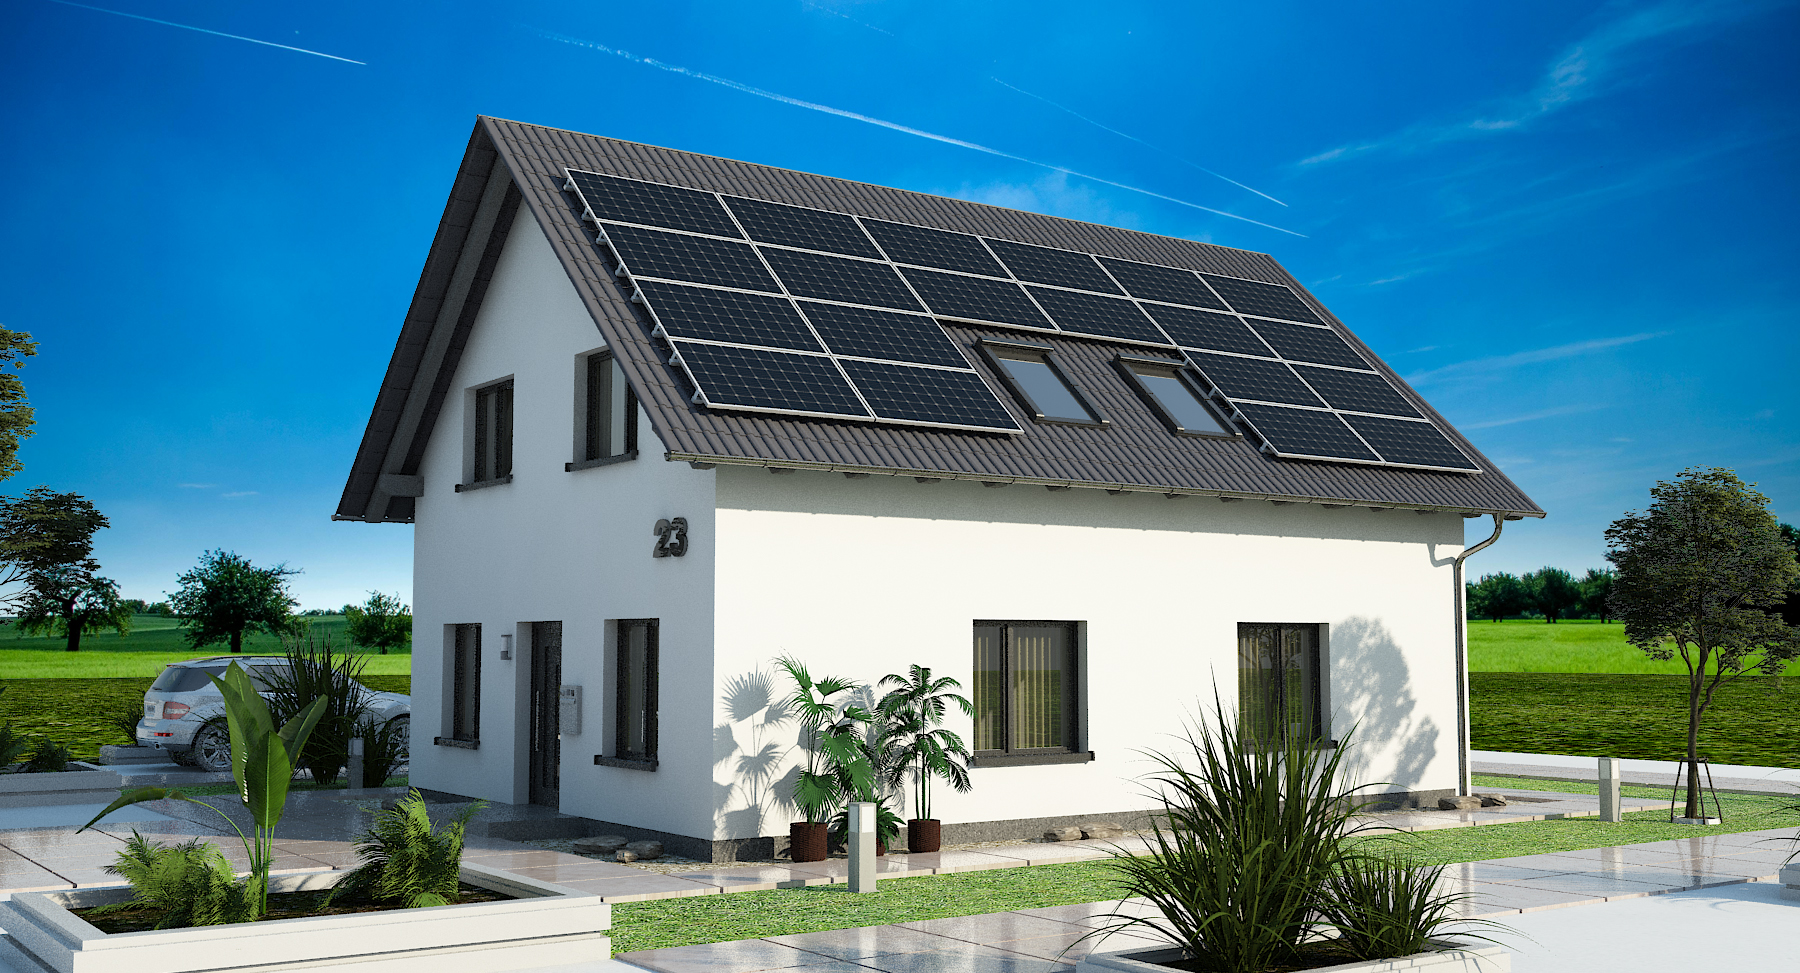
In the first phase of Evisuell+, an external visualization is presented with a precise representation of the architectural materials. In addition, the optical characteristics of the integrated PV system are accurately depicted, as there are various dimensions of these solar modules on the market. The exact dimensions and proportions of the selected PV modules are visualized and shown in these representations to provide a visual idea of the future characteristics of the building with PVs, coordinated with the color and physical properties of windows, walls, roofs, and other external components.
2.
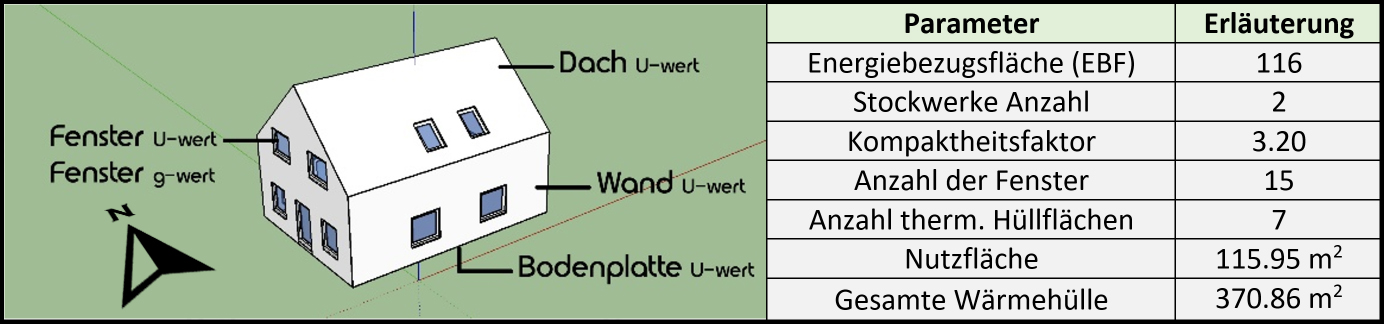
Project overview
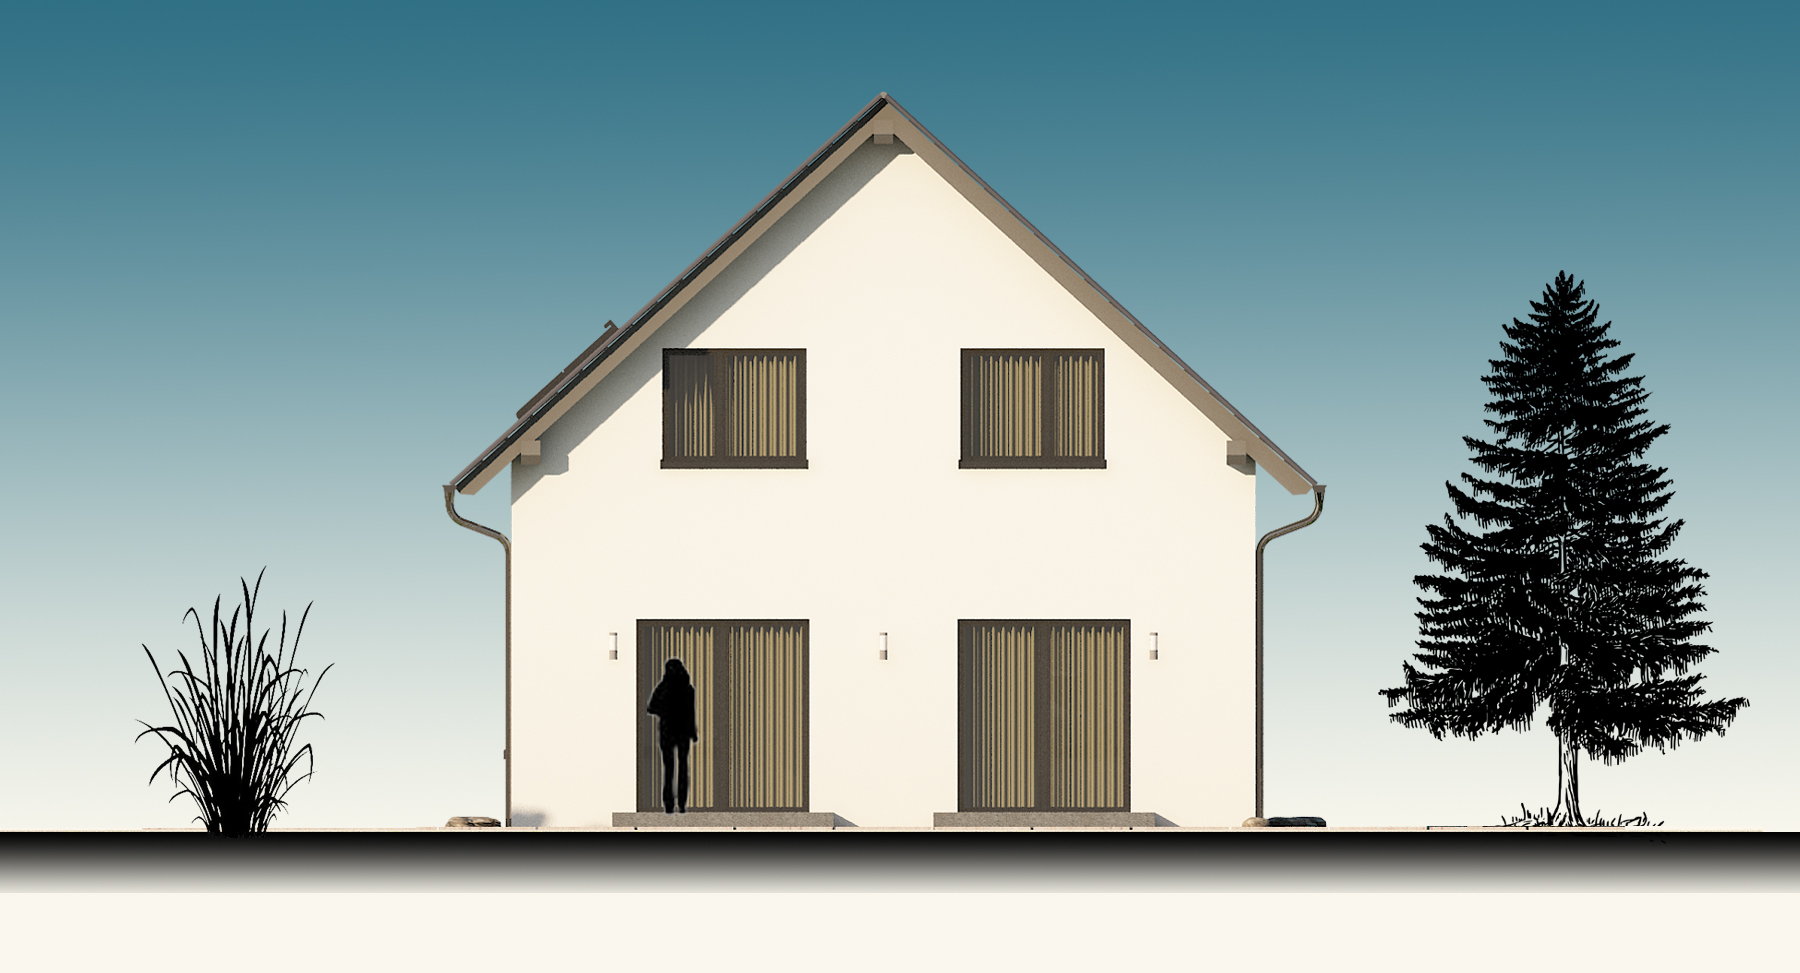
Here, the physical properties of the entire building envelope are presented, which can facilitate the next constructive phase of the project.
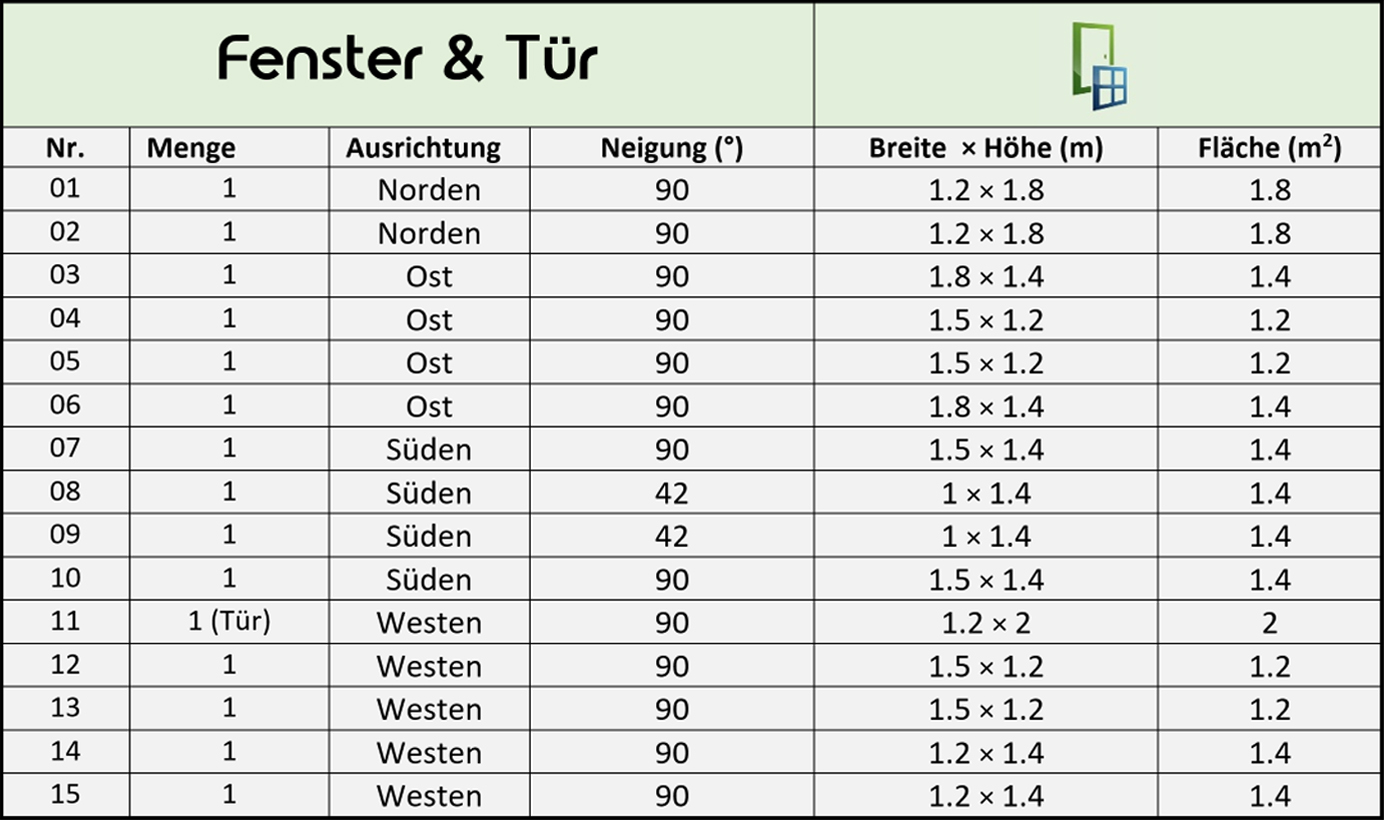
All windows and doors, along with their number, orientation, inclination, dimensions, and area, are listed individually in a separate table.
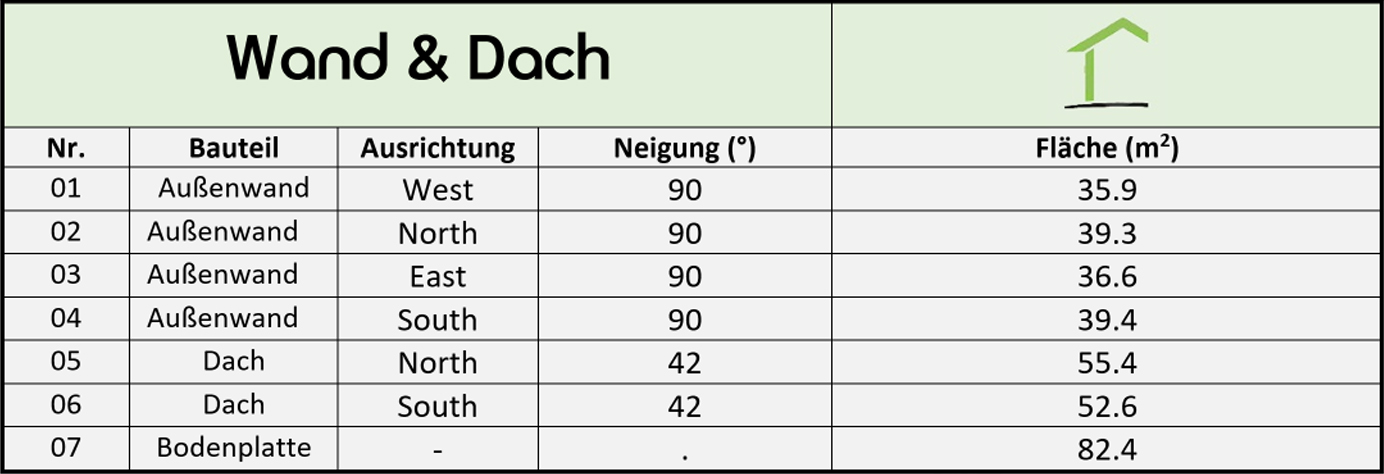
Orientation, slope, and area of all surrounding walls, roofs, and ceilings are calculated individually.
3.
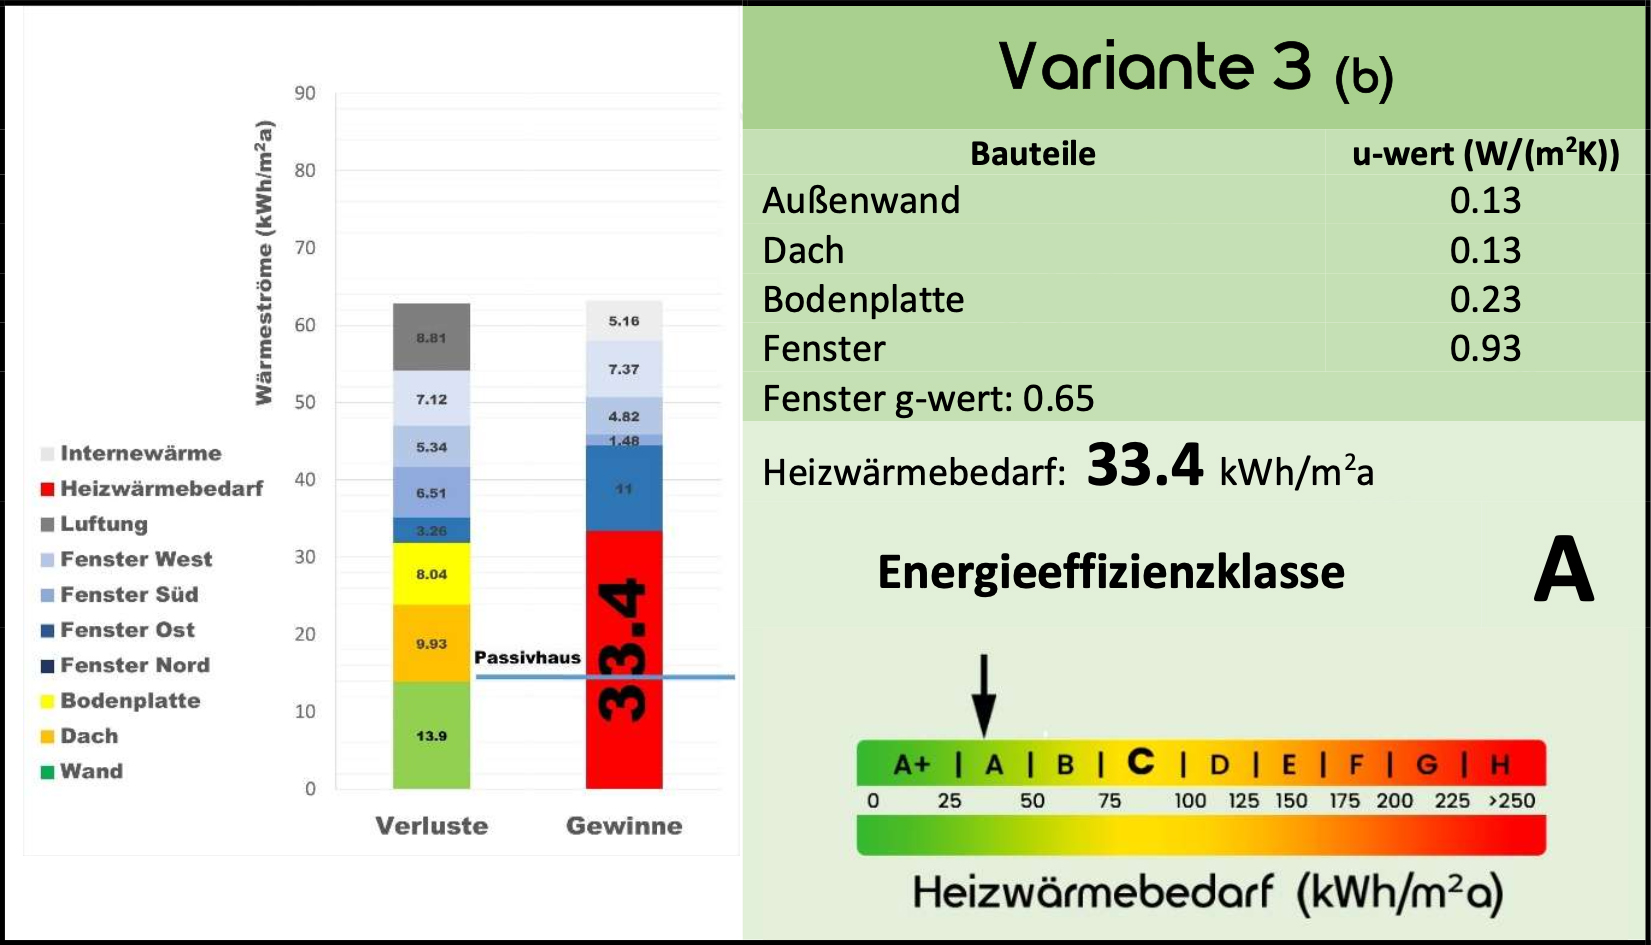
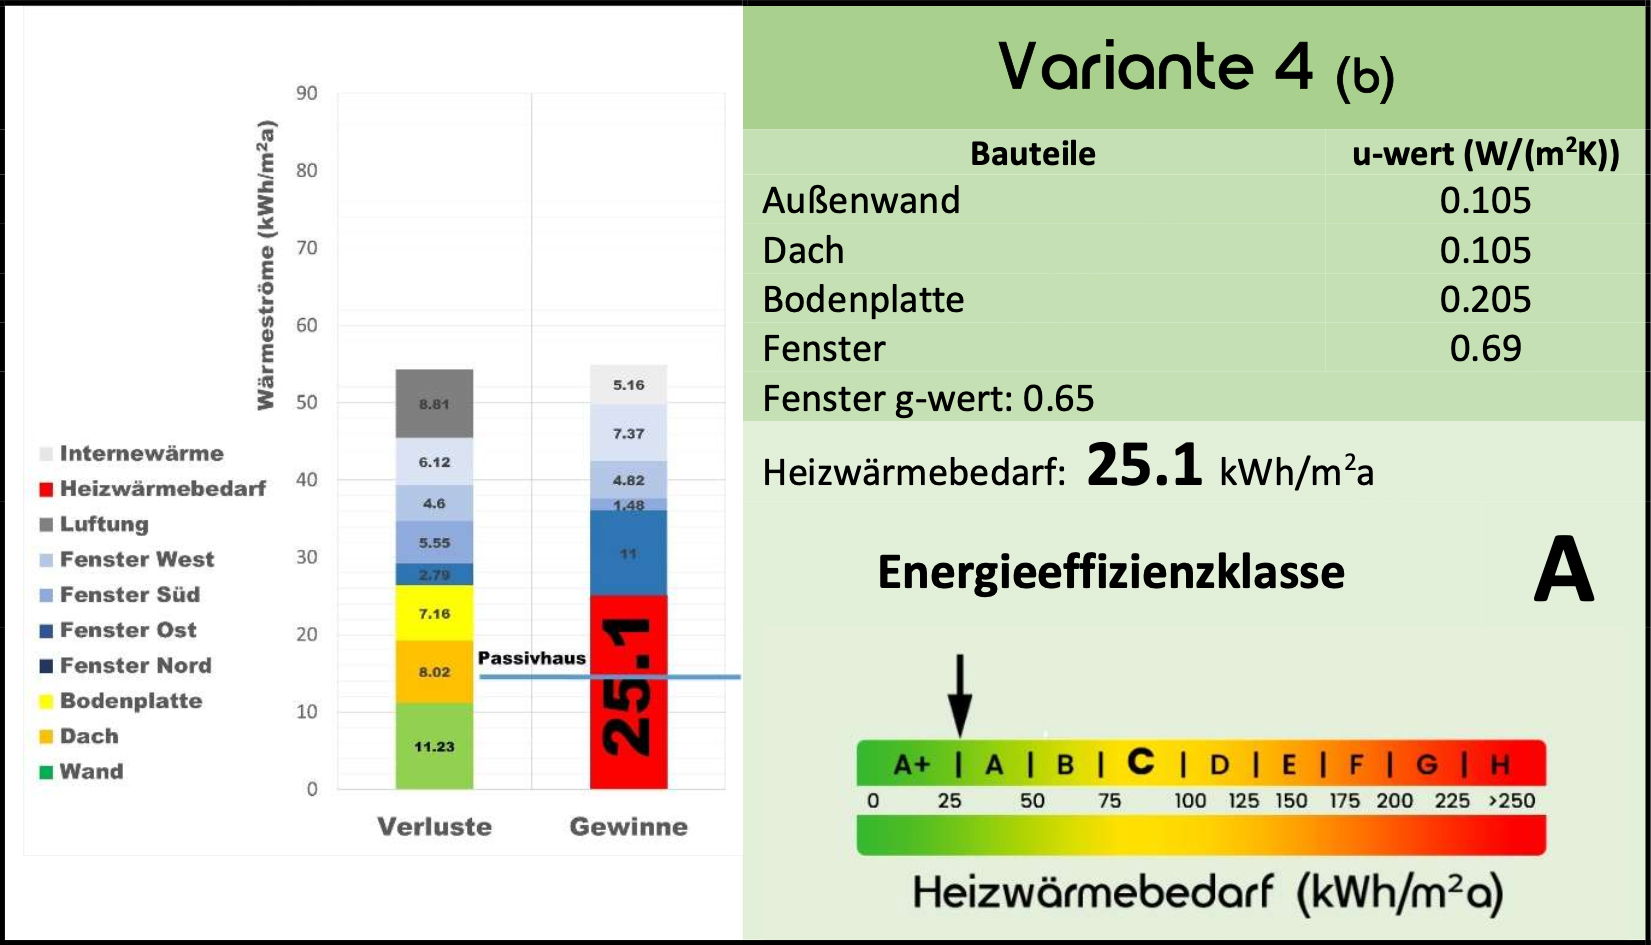
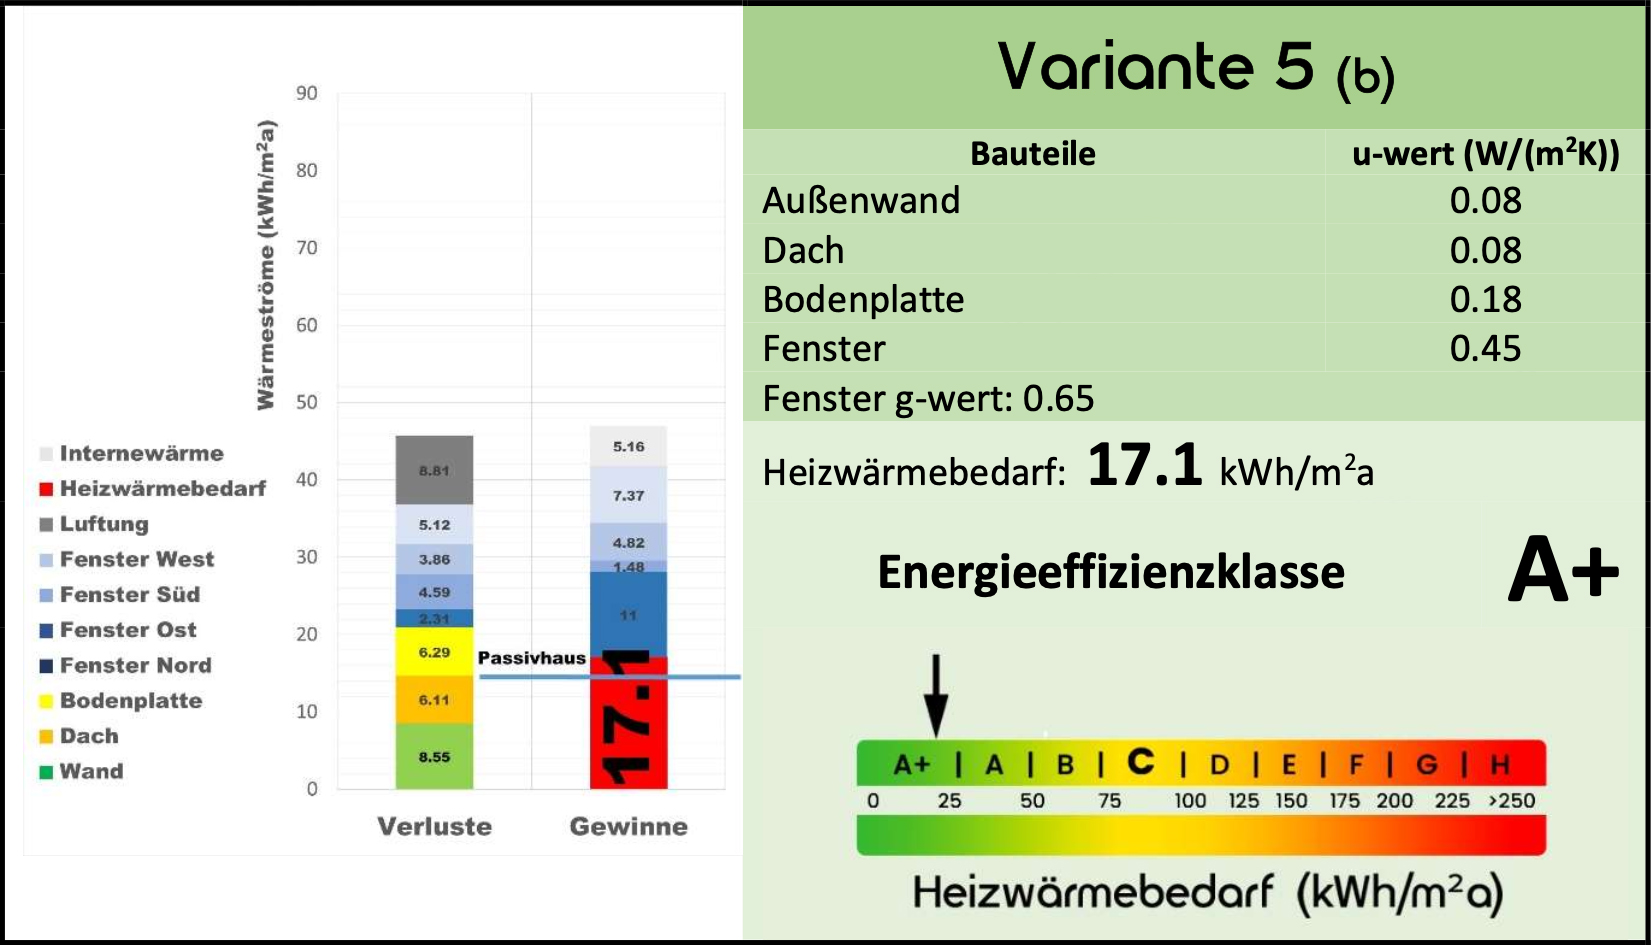
Energy efficiency class
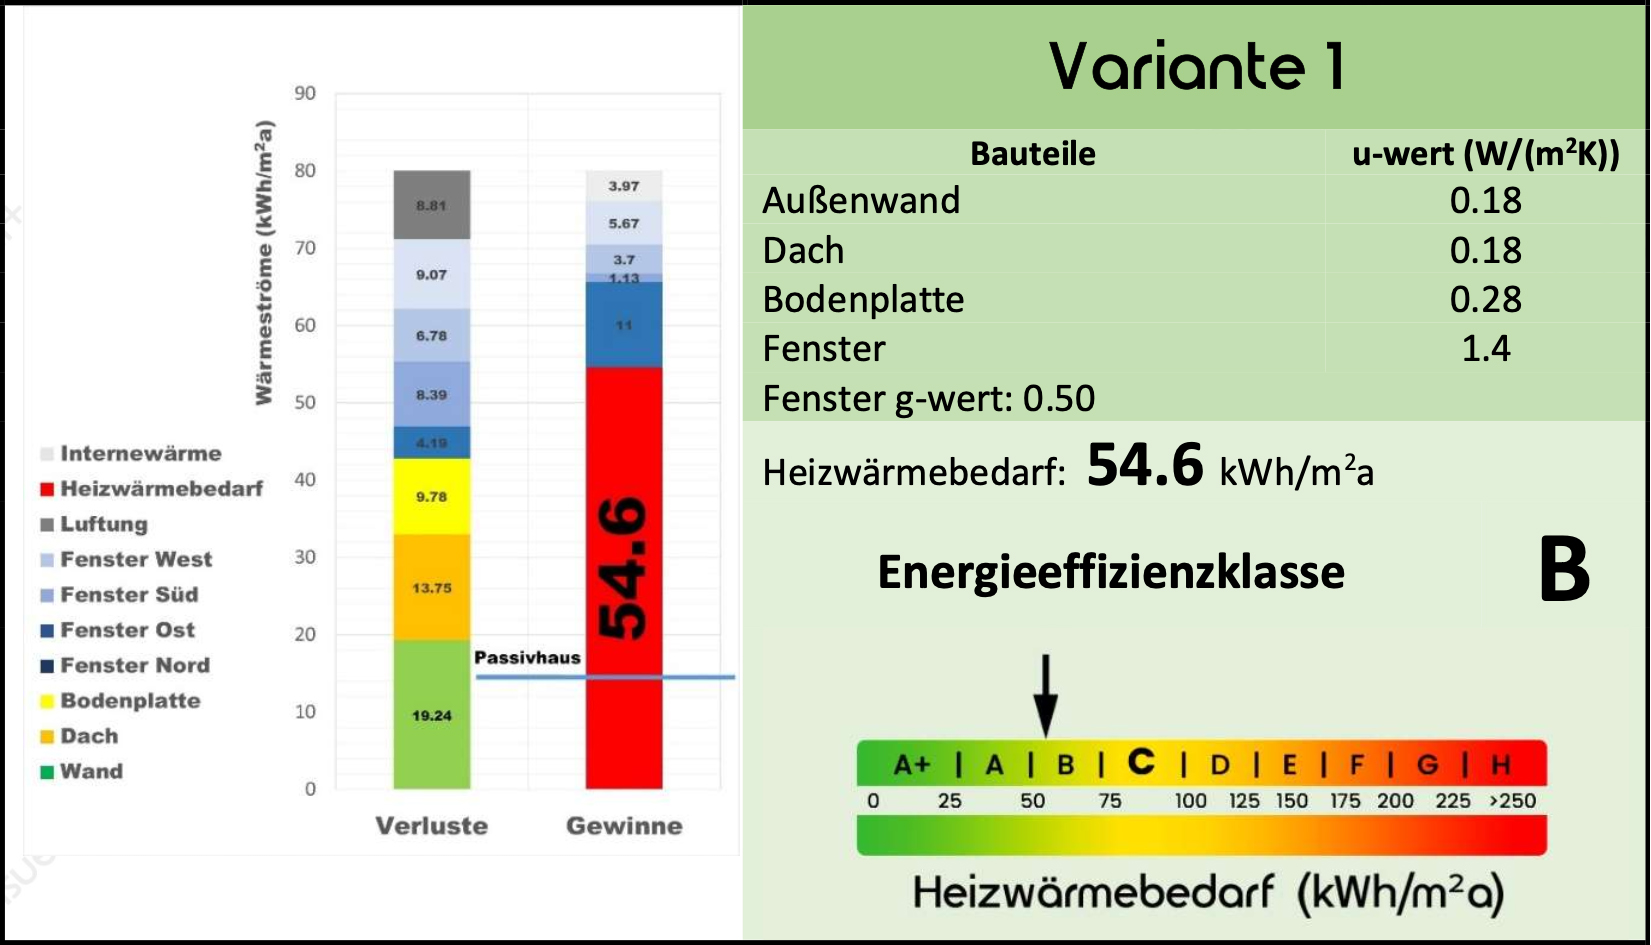
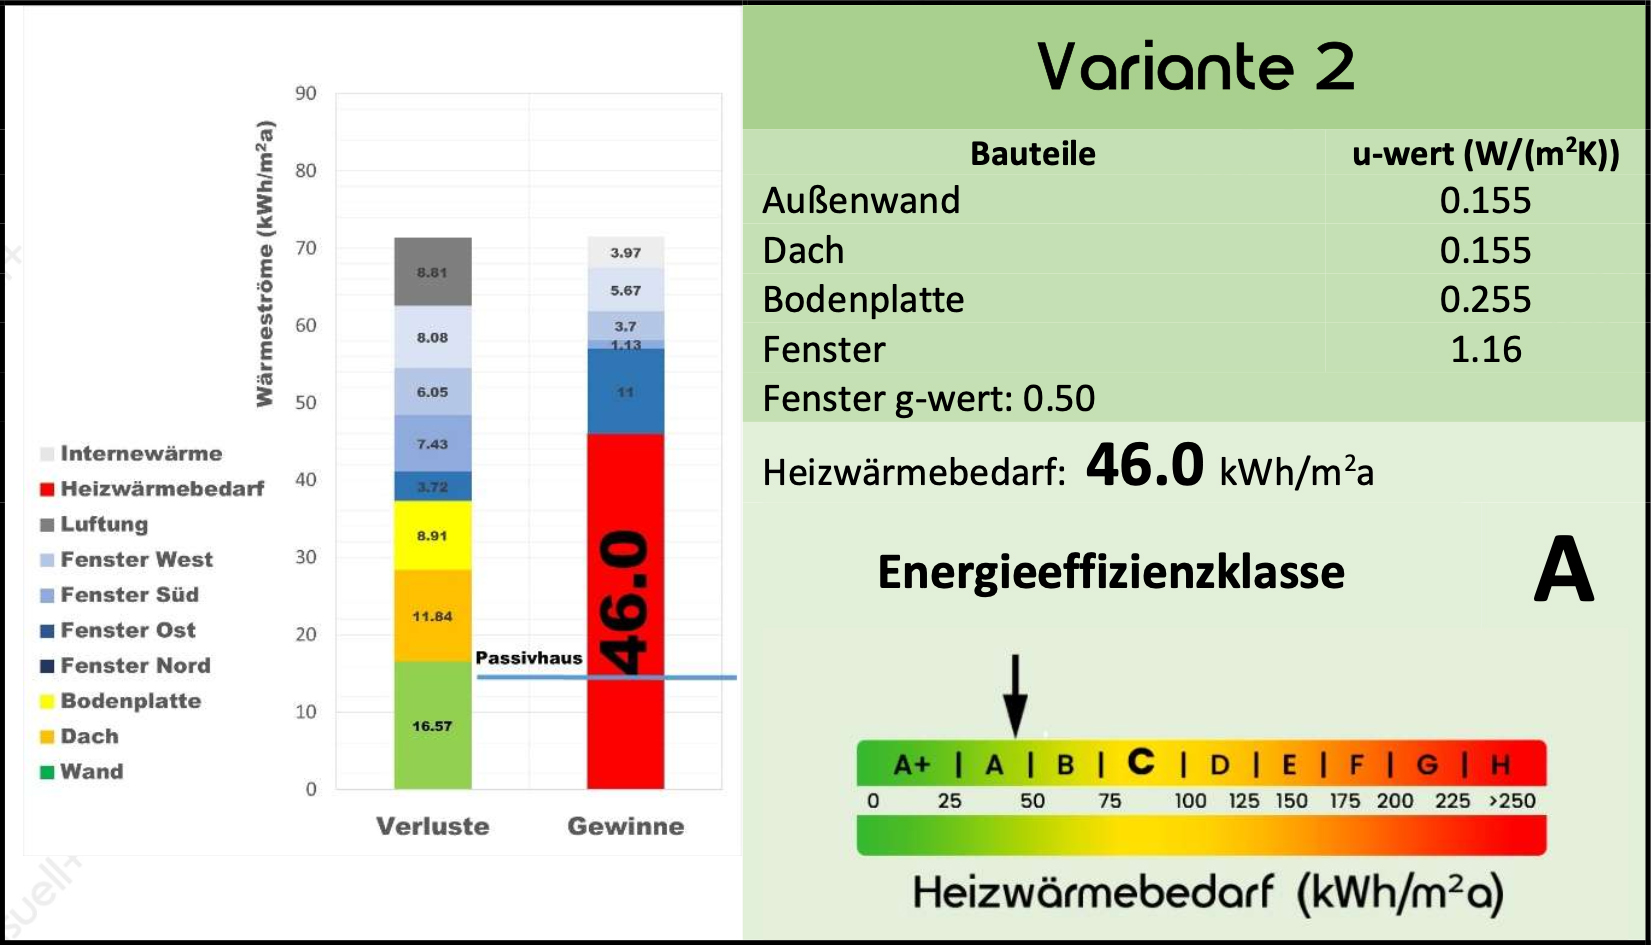
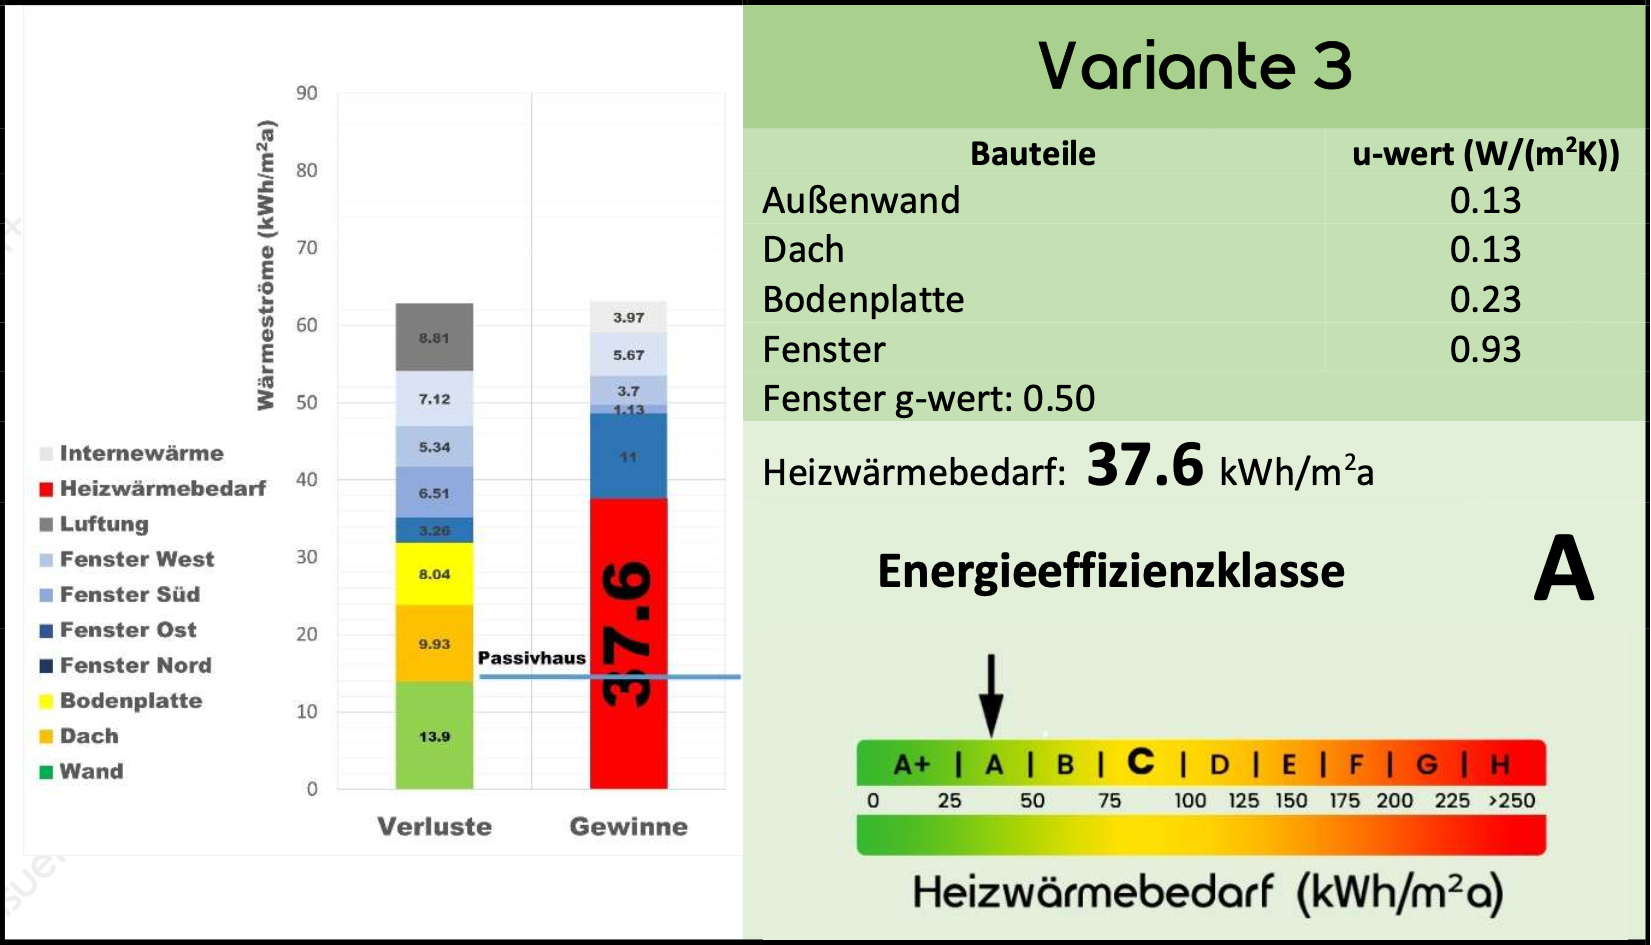
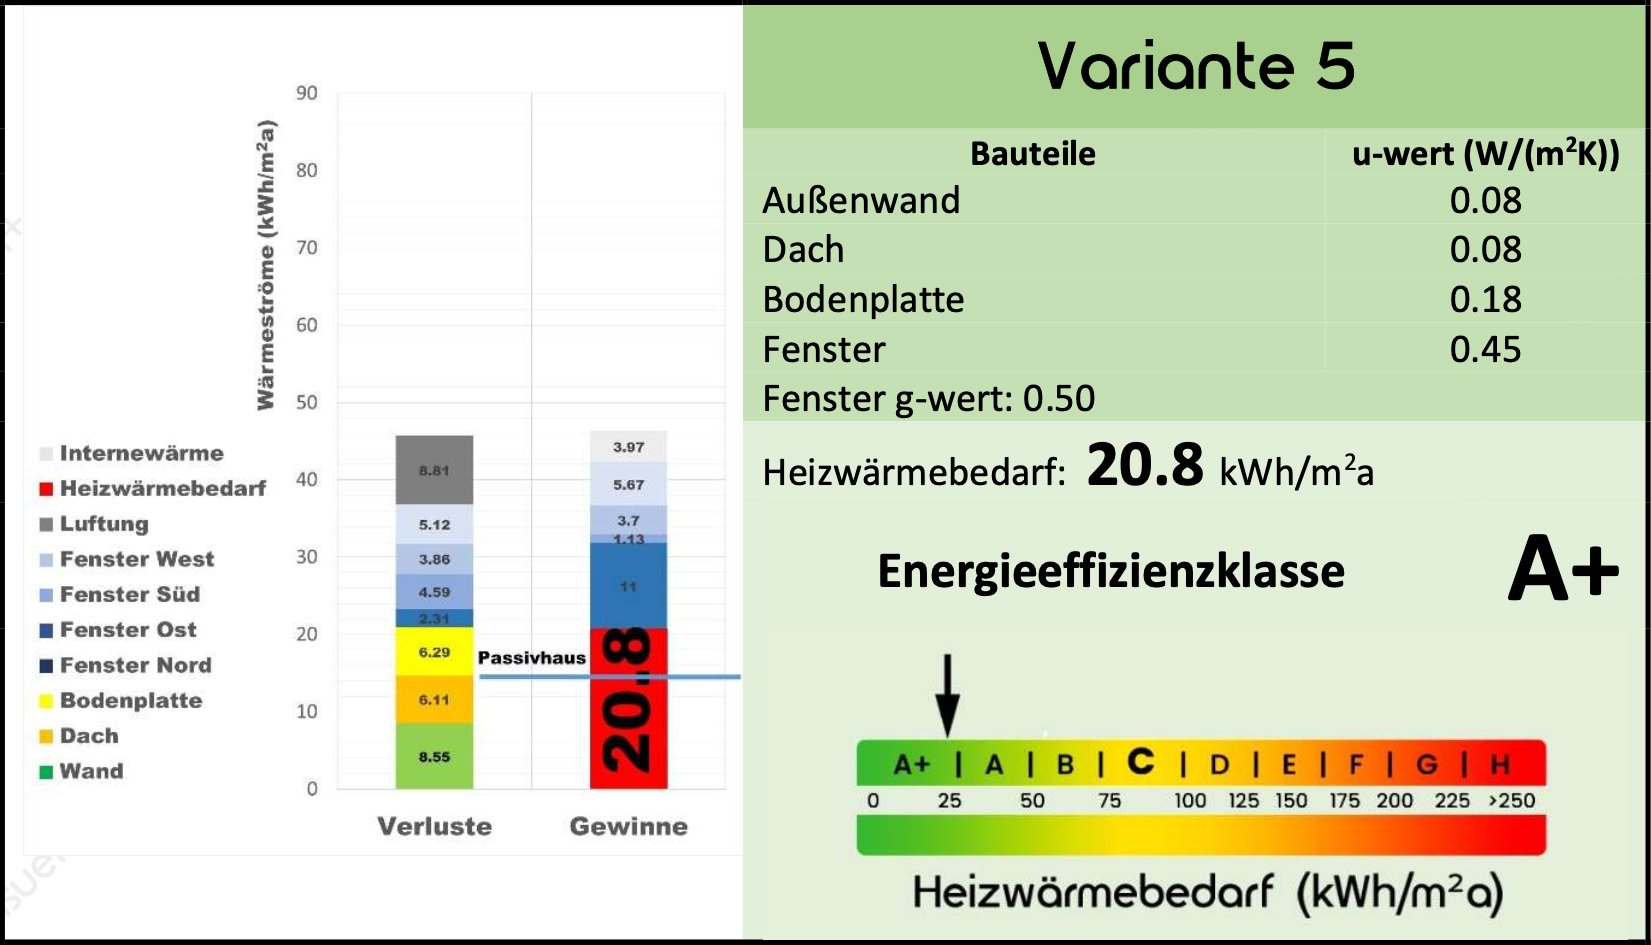
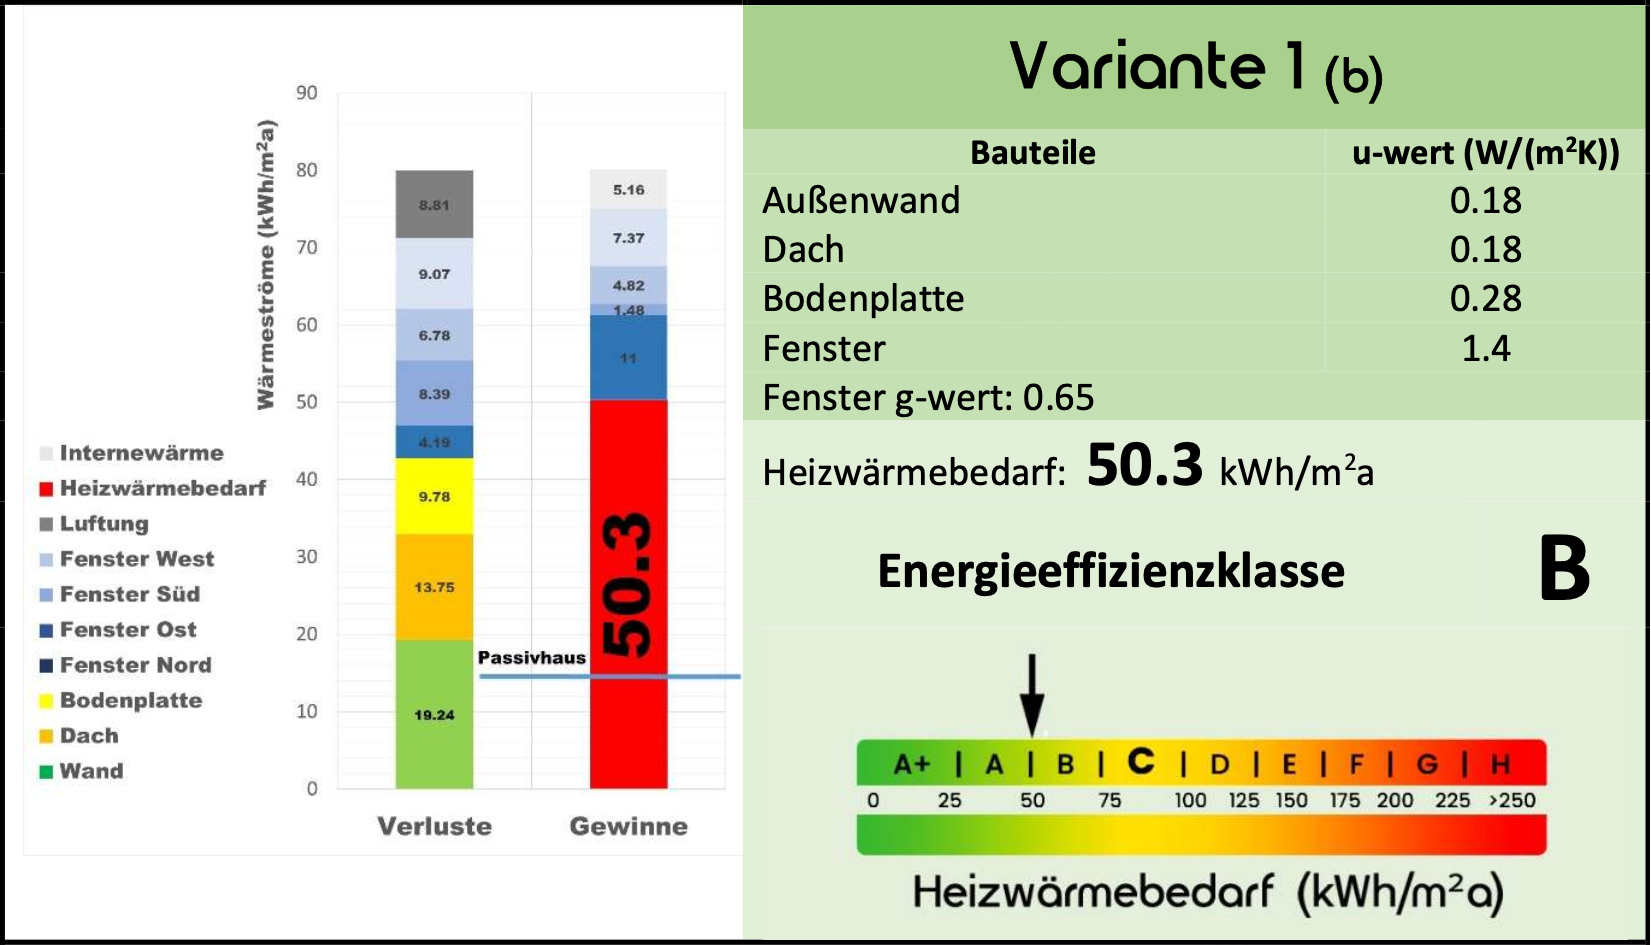
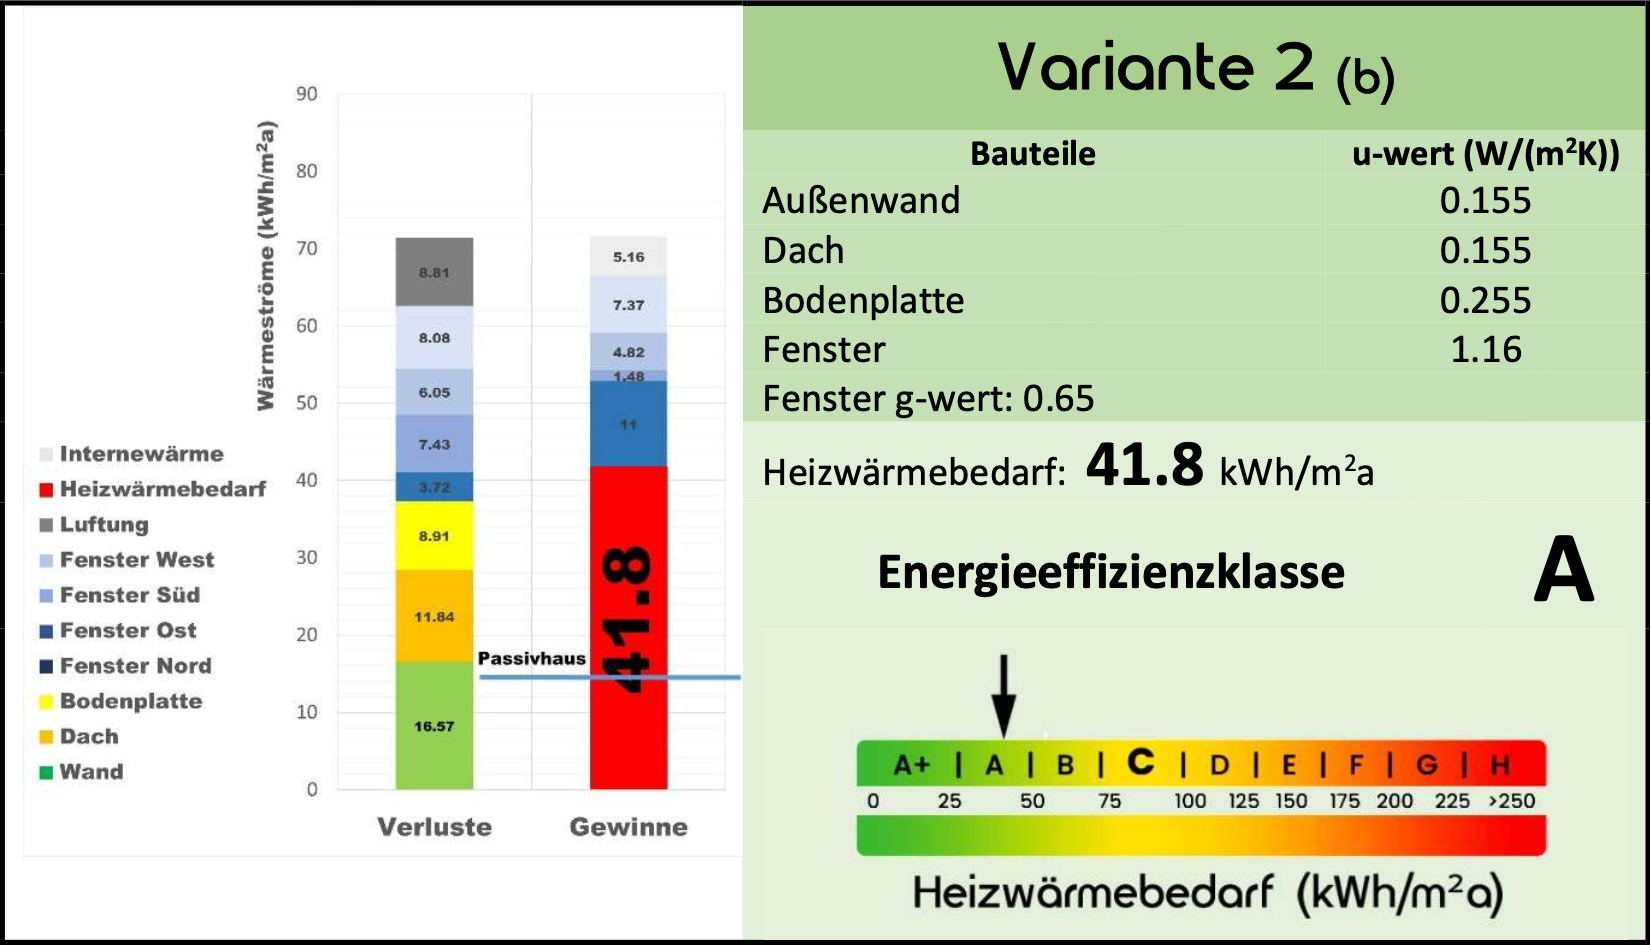
Five different material combinations for external walls, roofs, ceilings, and windows were used and compared to estimate the energy efficiency class that the building could achieve if the corresponding materials were used in construction. Variant 1 demonstrates the heating energy requirement using the highest heat transfer properties of the material, while Variant 5 shows the best material properties in terms of market availability. The first five main variants have different U-values for the windows, but the same g-value of 0.50.
The second five variants use the same windows as variants 1 to 5, but with a g-value of 0.65.
Therefore, if there is a better g-value for windows on the market in terms of price and customer preference, five additional variants also predict changes in the energy efficiency class of the building.
4.
PV power generation
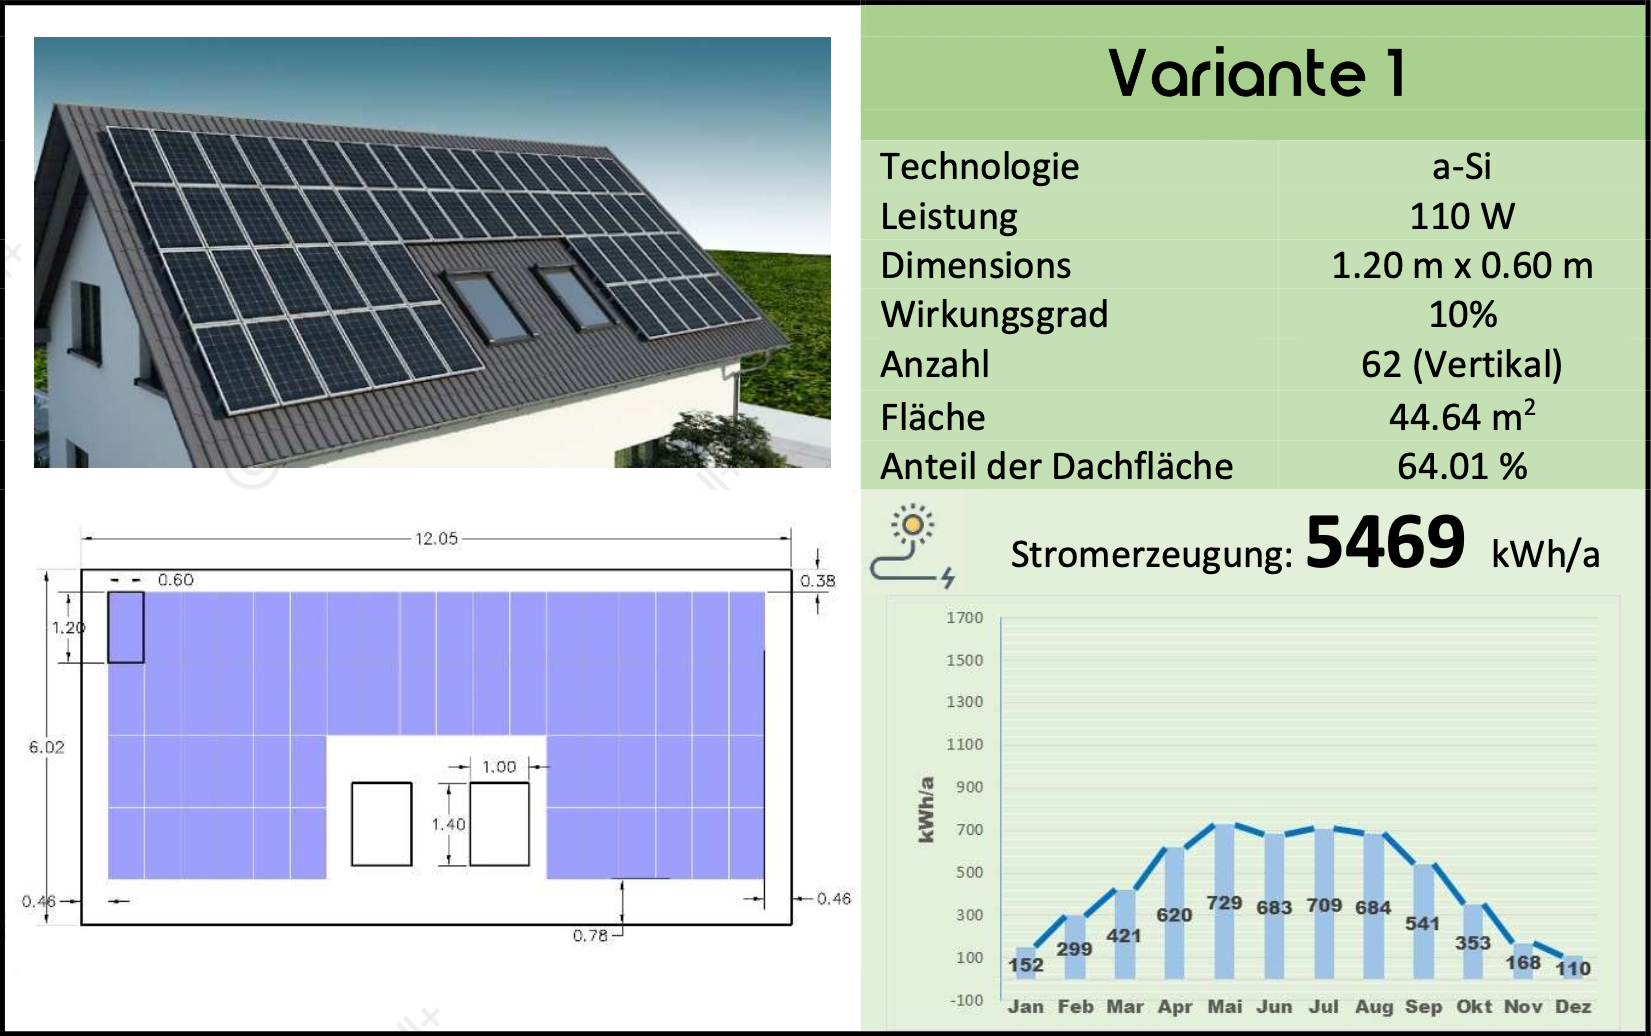
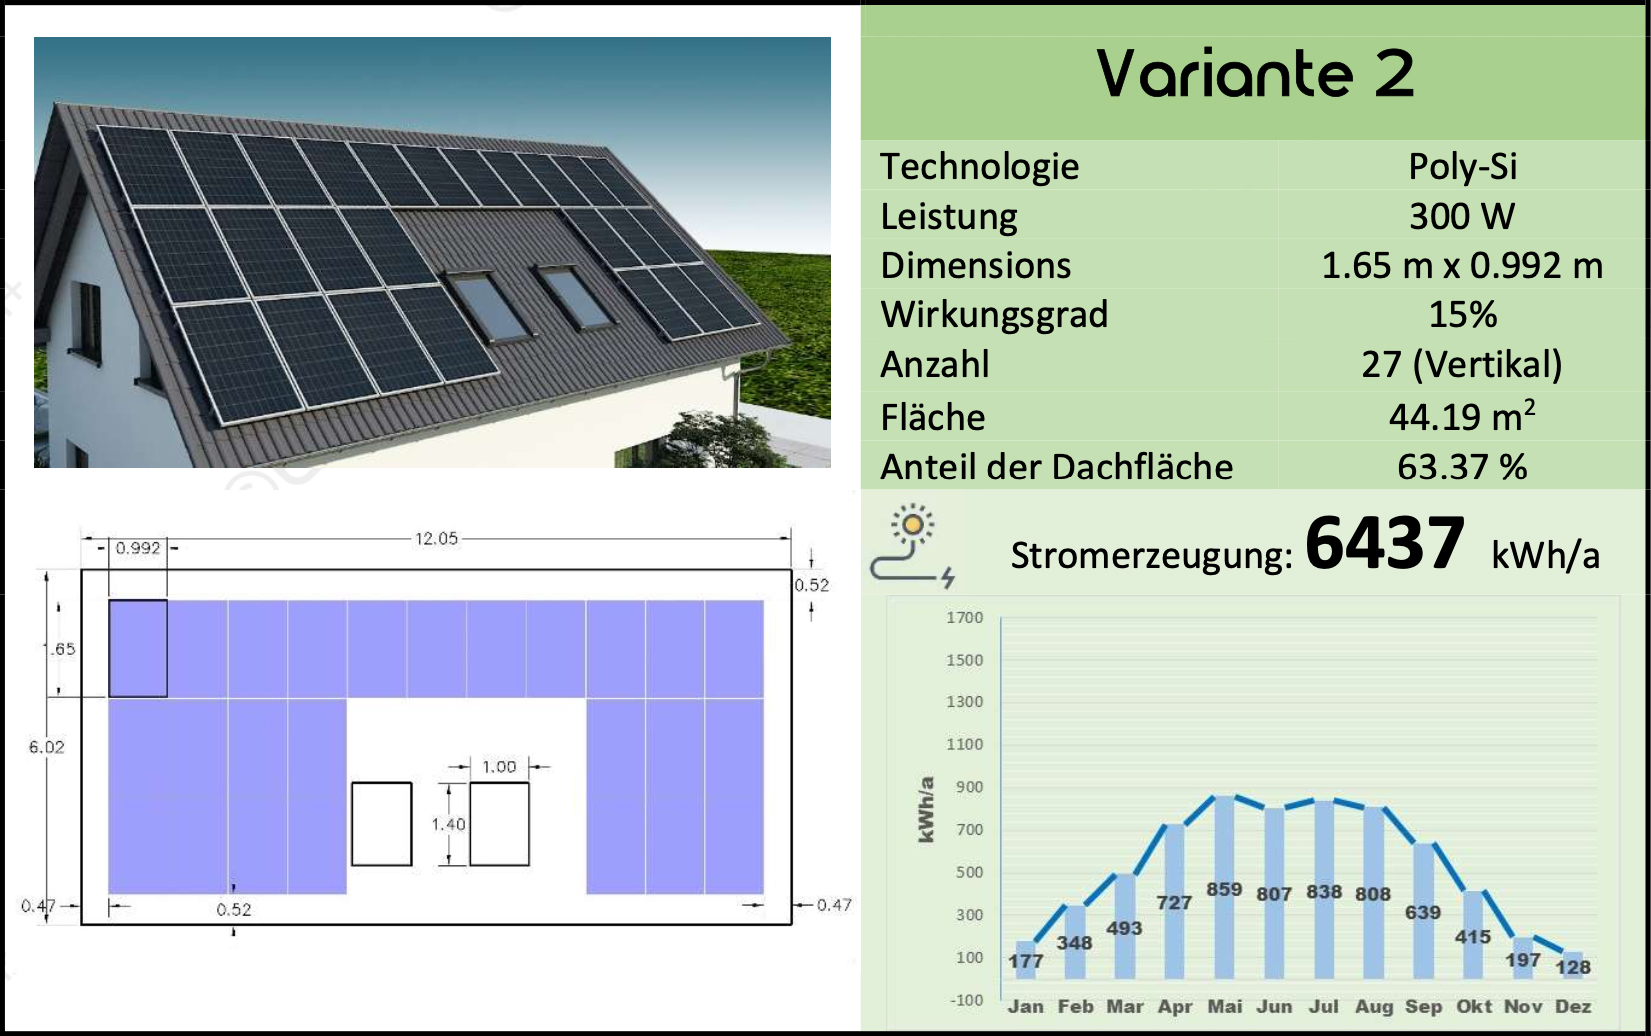
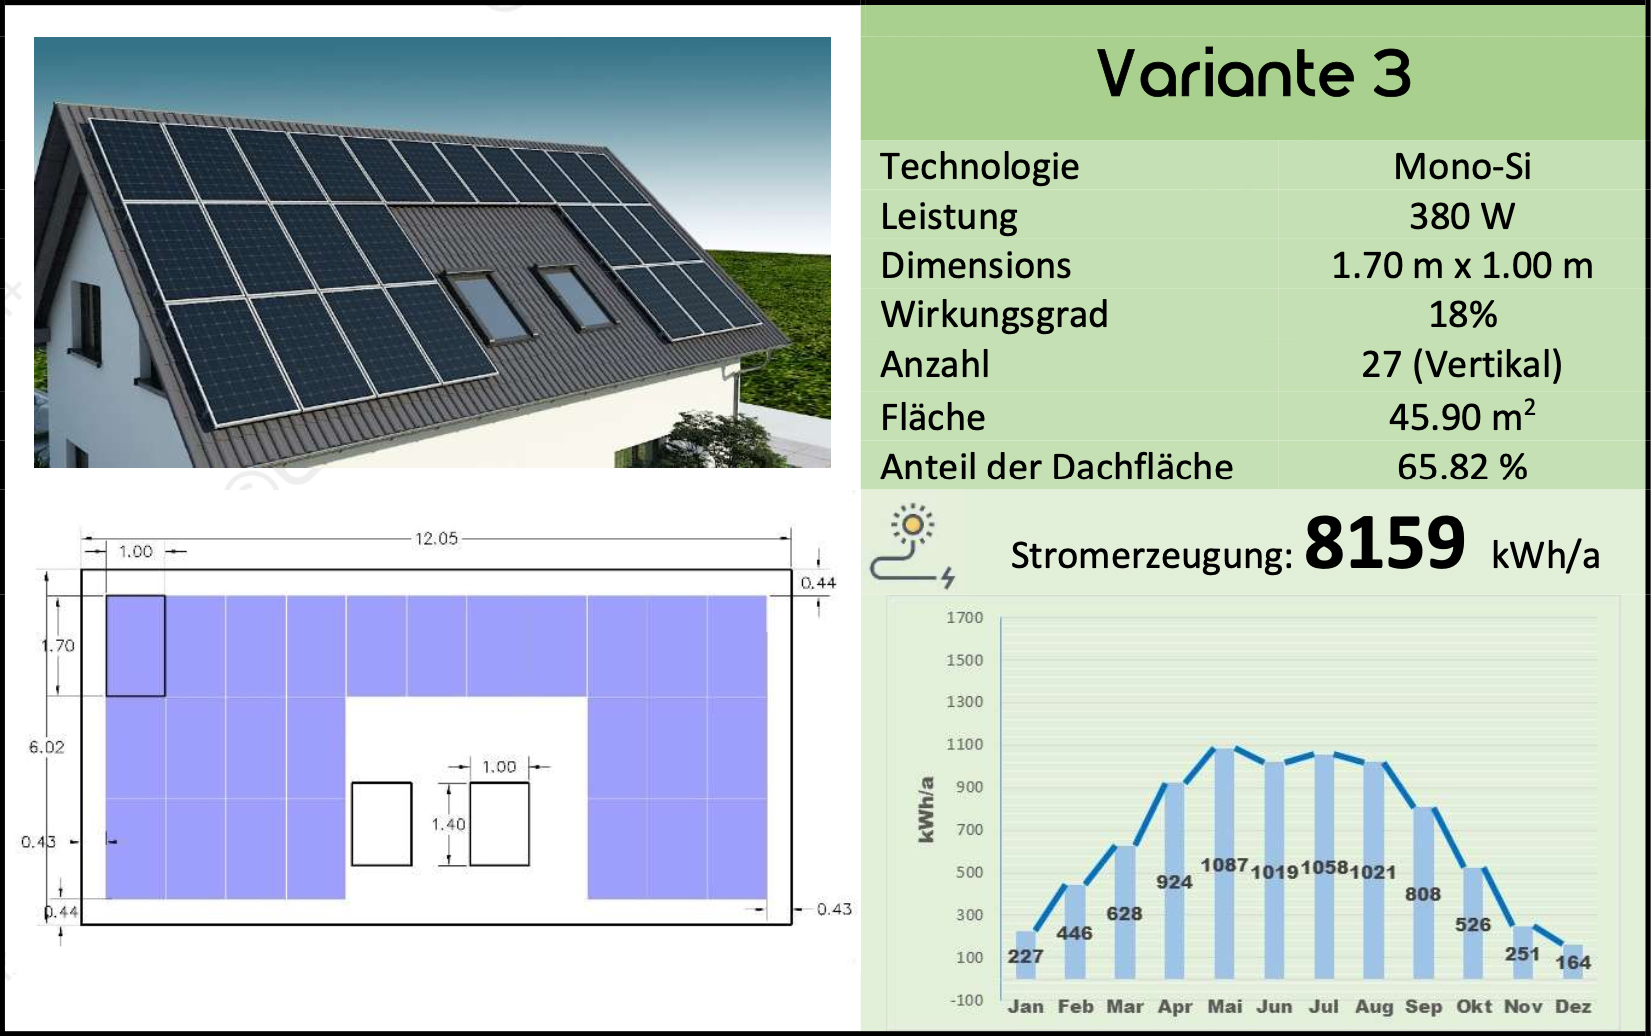
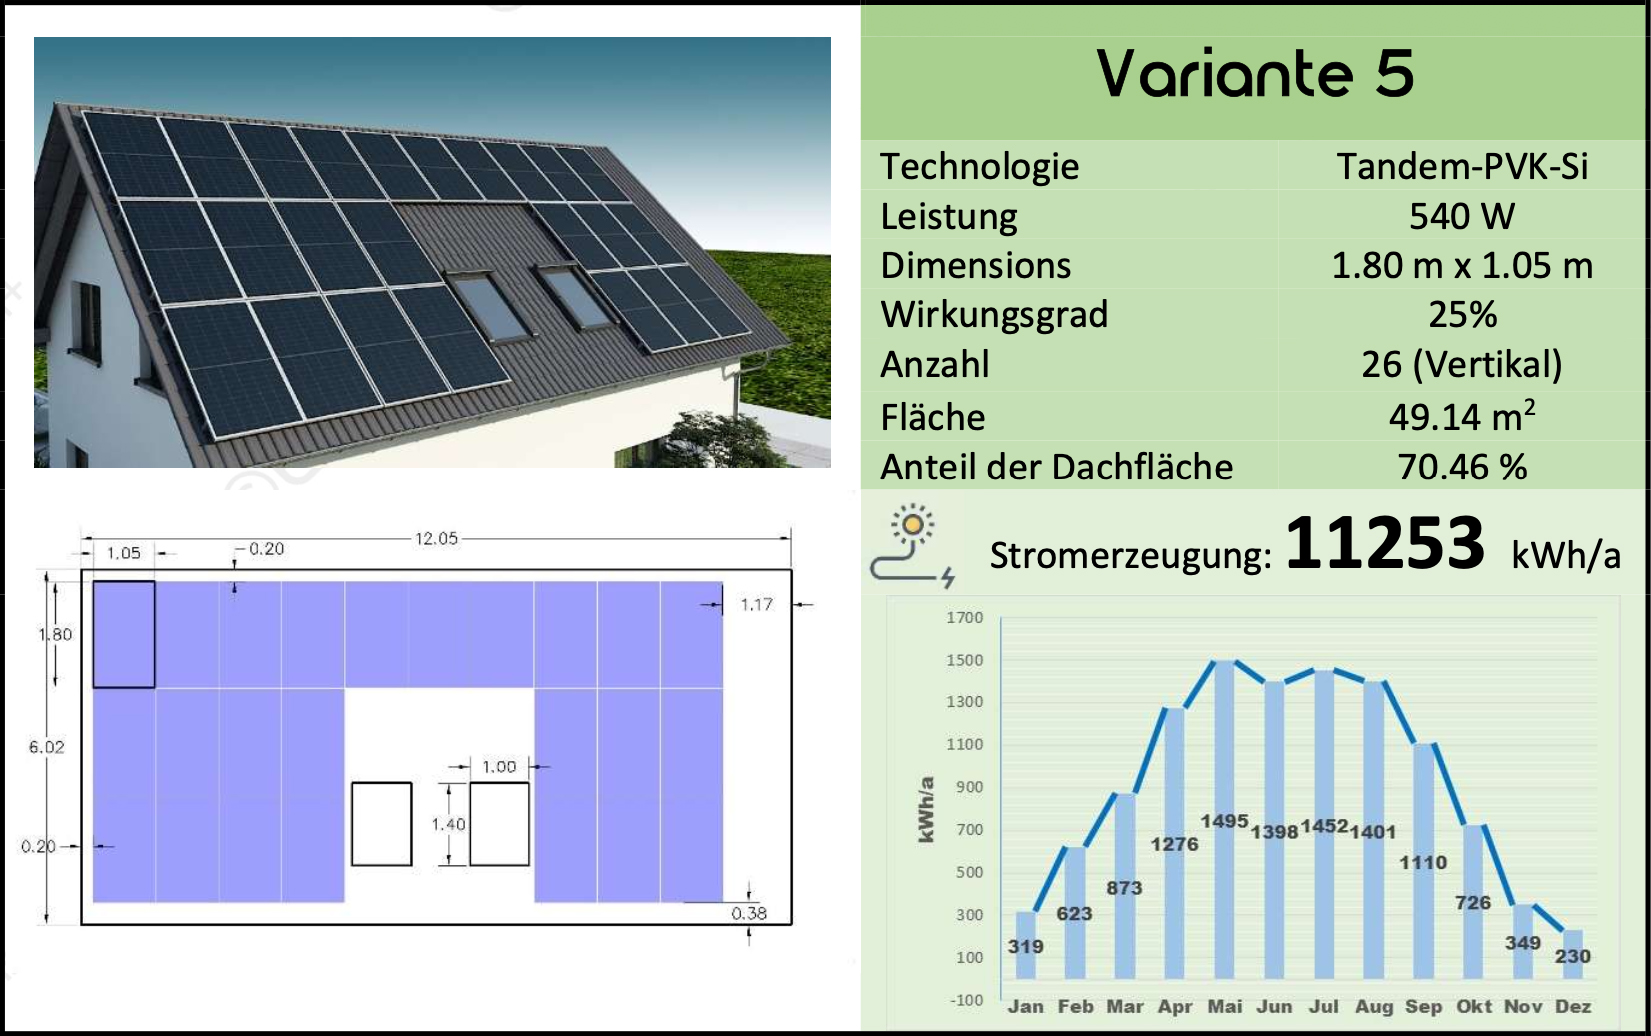
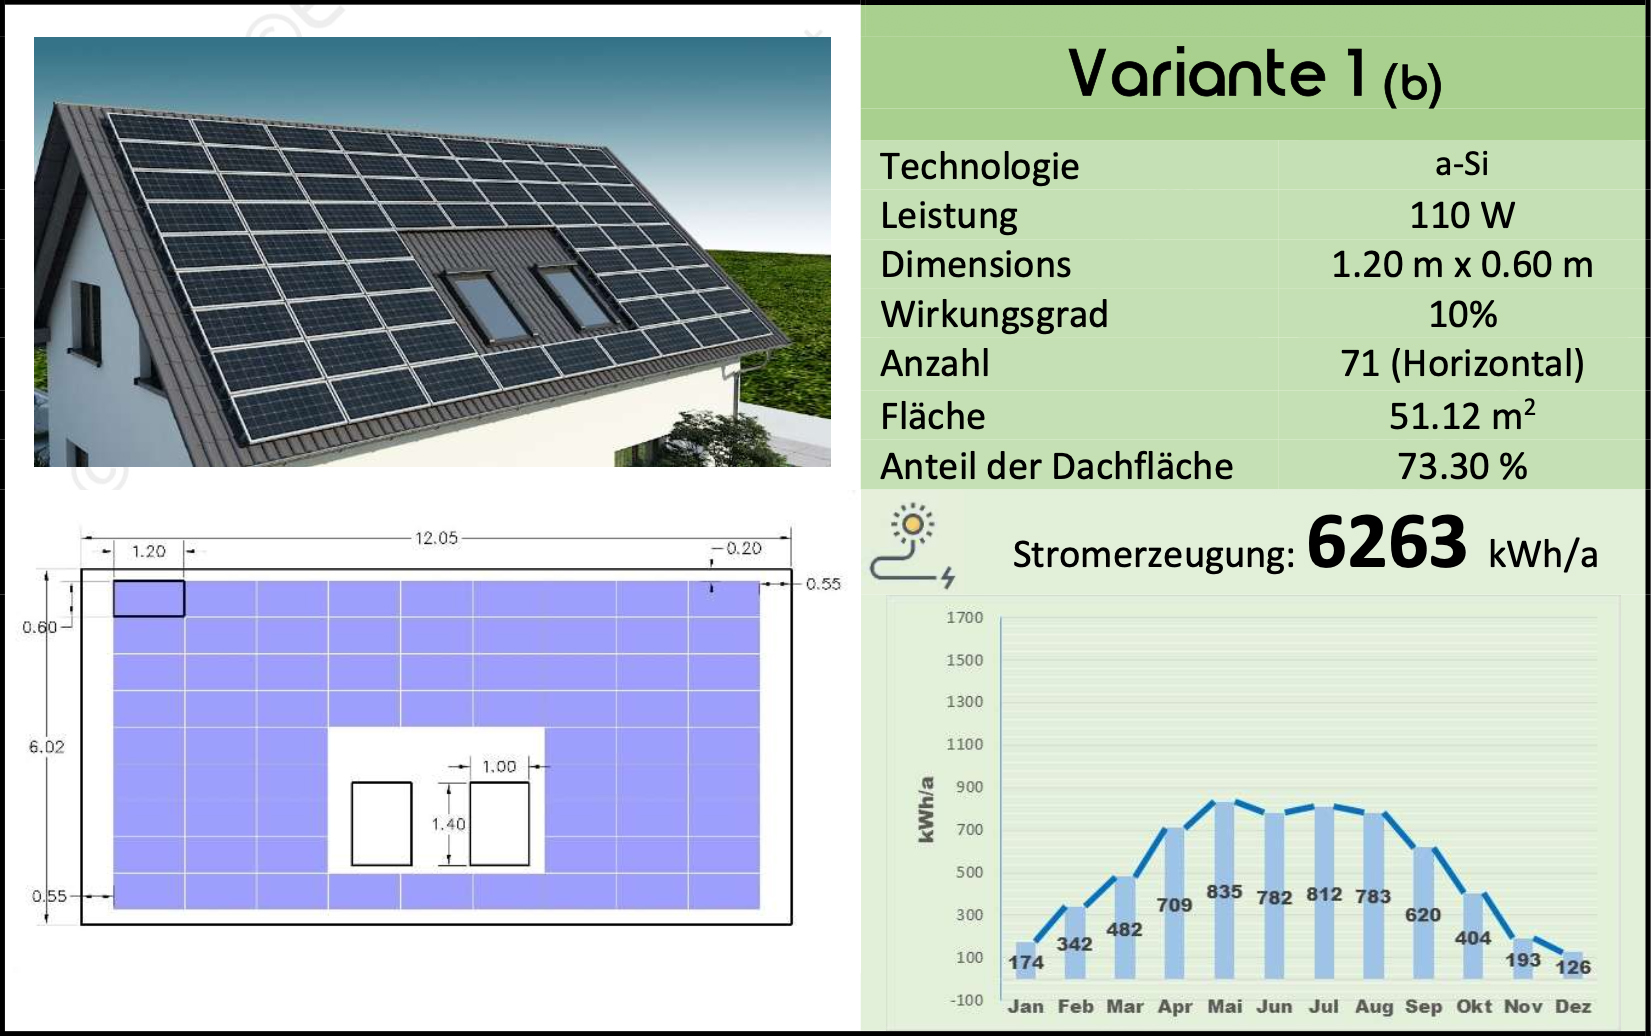
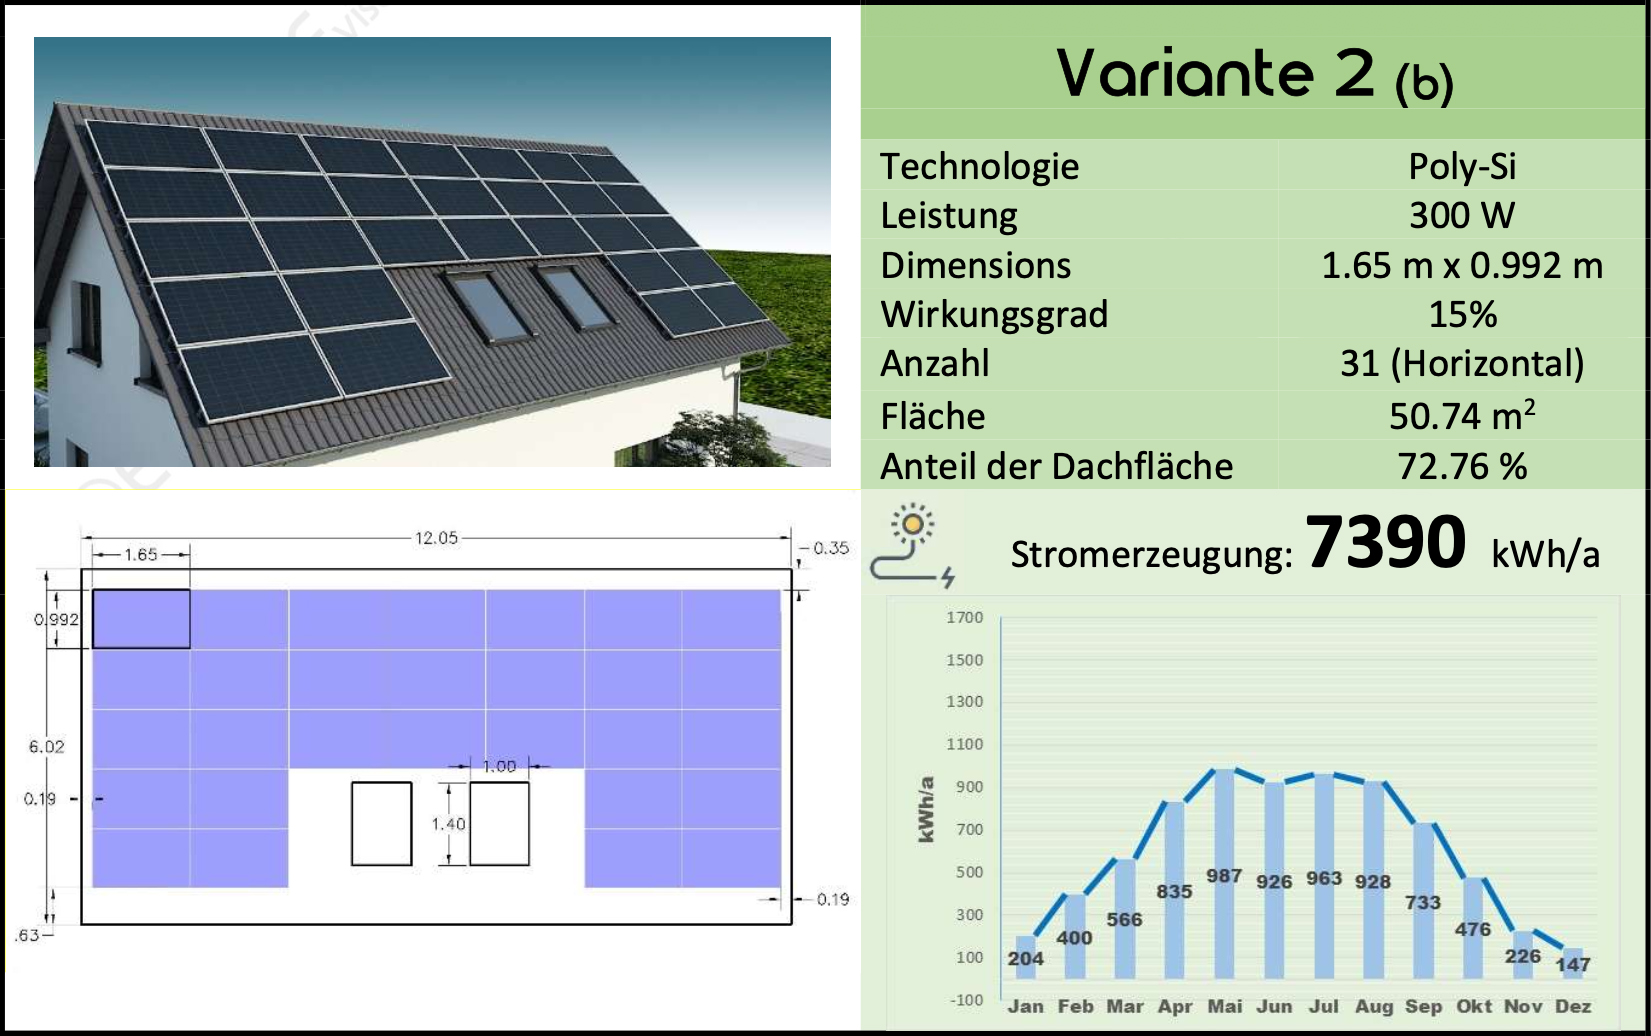
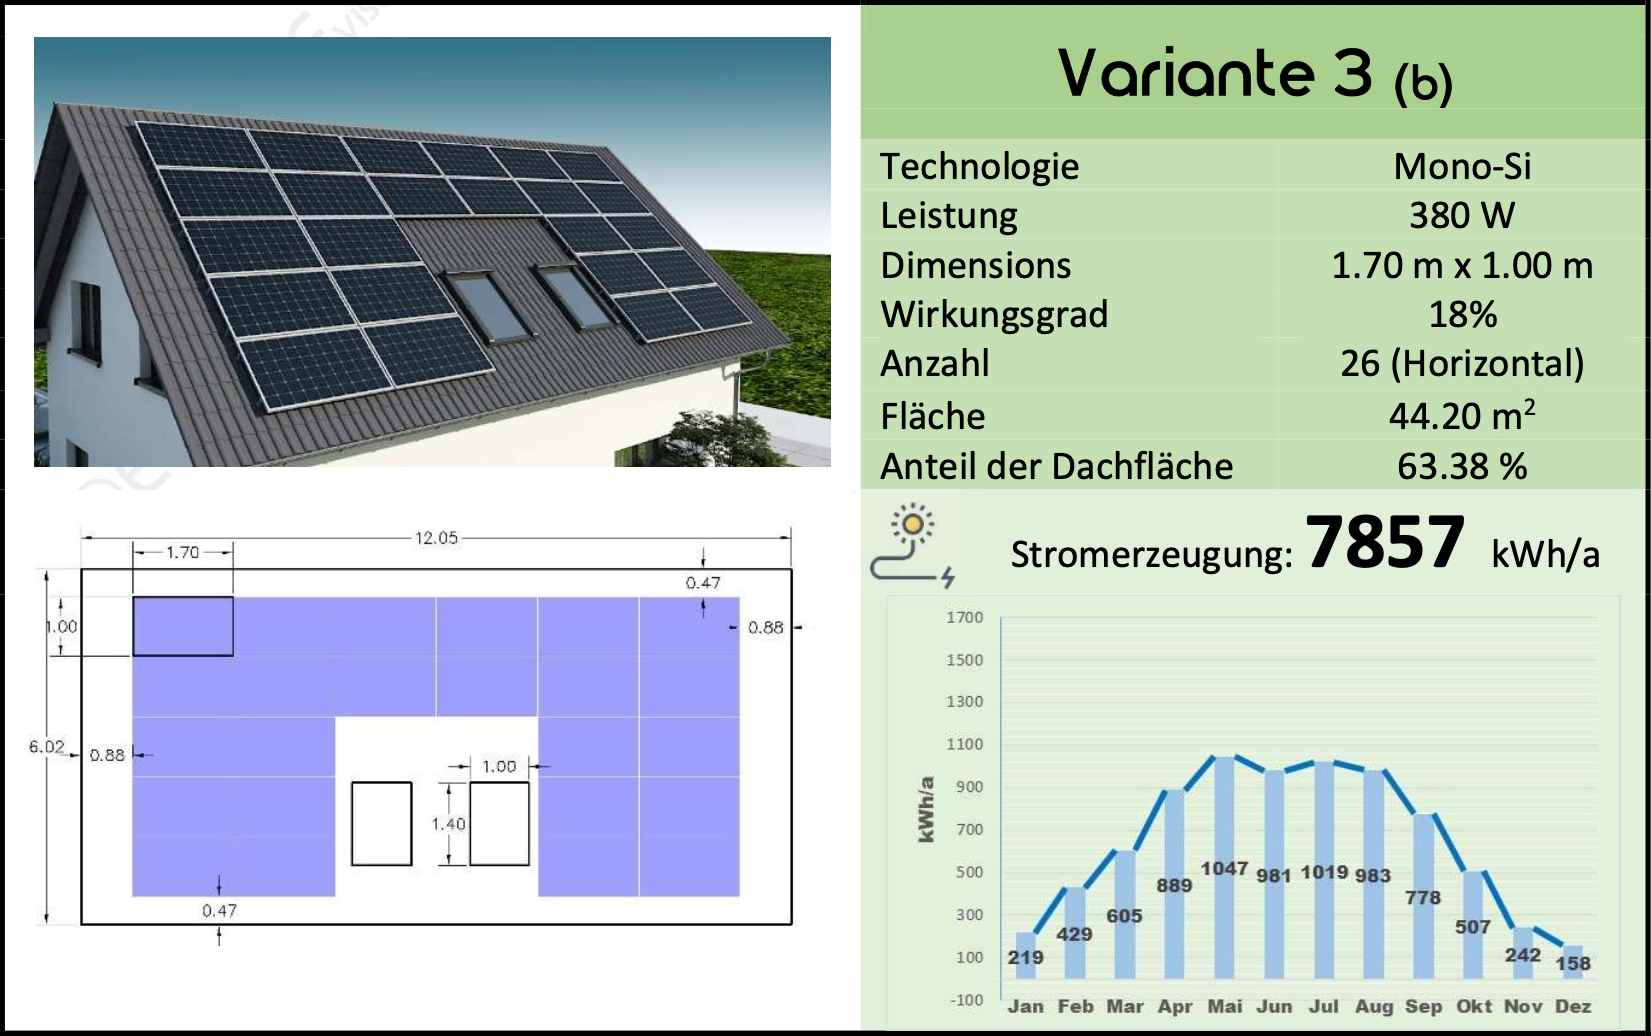
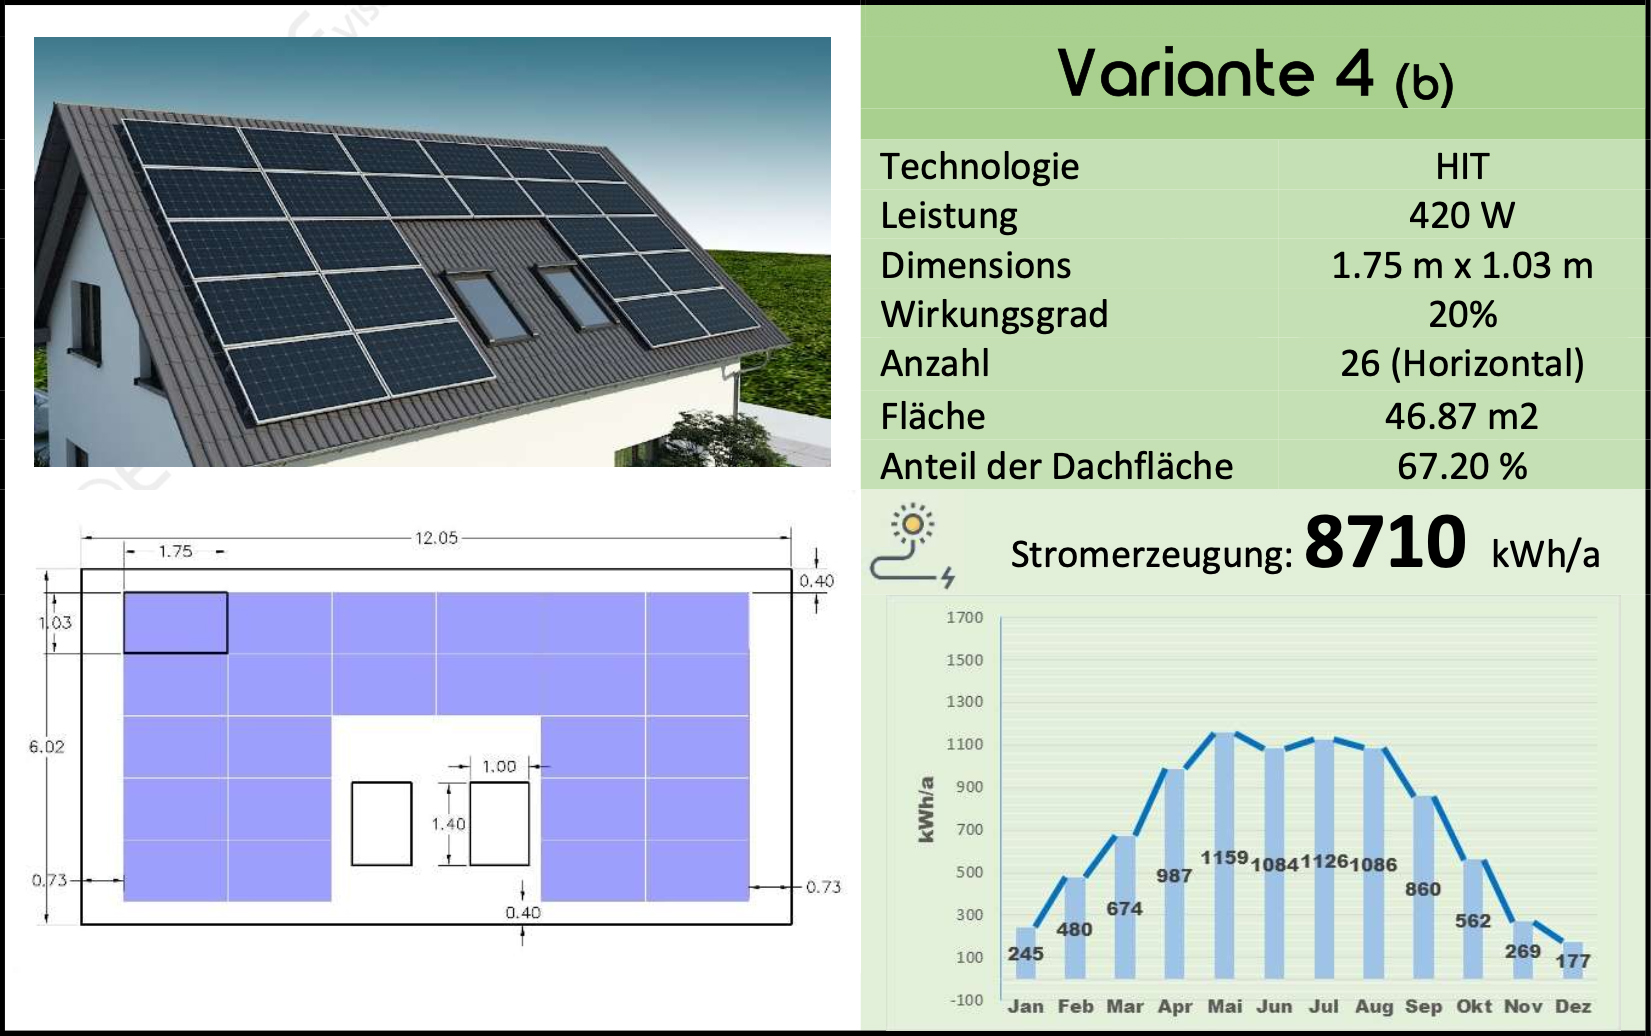
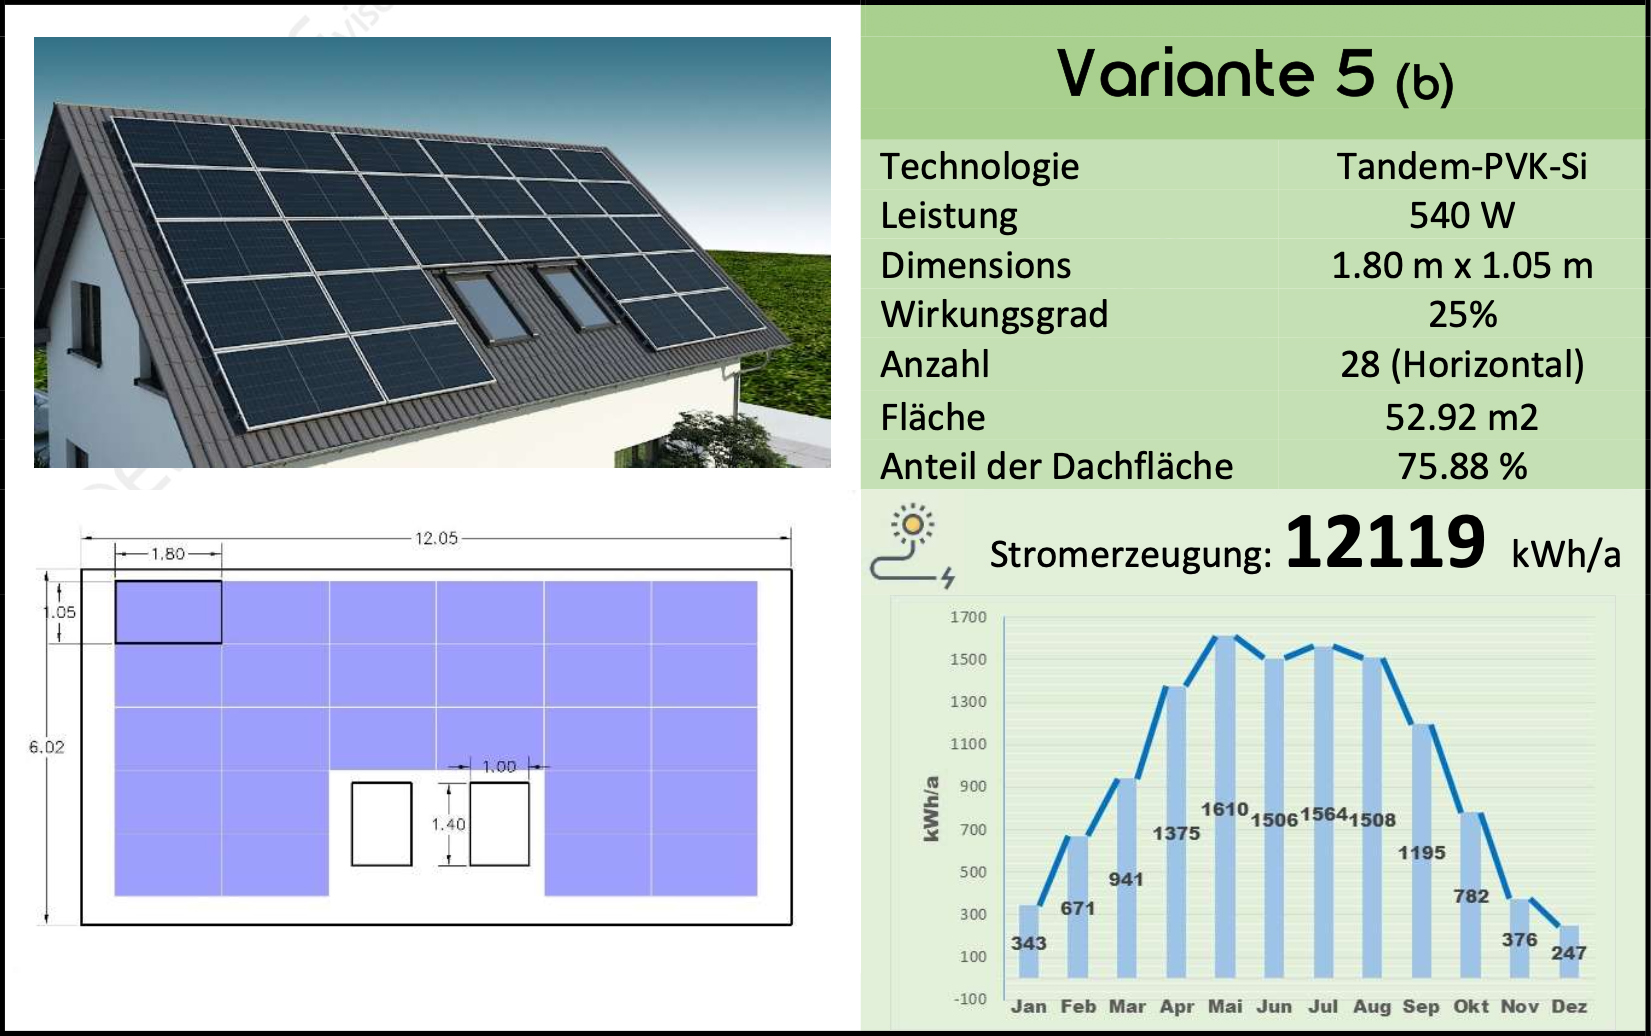
Variants in terms of the area of PV integration are developed, considering the different PV systems available on the market with varying efficiencies, to compare the building's potential for generating electricity in each PV integration configuration. The chosen variant is then used to determine the exact dimensioning of the integrated PV system and to create a realistic final visualization. Since PV is mandatory in some federal states in Germany, the minimum requirement for the coverage area (often 60%) is applied to determine the optimal energy generation potential of the building, as long as the required integration area is compatible with the available roof.
Five variants from 1 to 5 show the level of electricity generation of a building when the corresponding roof side is covered with PV systems of different technologies and efficiencies. These five categories were selected based on the types of PV available on the market. In each variant, a true 3D optical visualization of the roof with the exact optical performance of the selected PV systems provides a realistic idea of what the roof will look like after the installation of the respective PV type.
The first five variants show the integration of five different PV technologies with varying efficiencies in a vertical assembly configuration.
The second five variants show the integration of the same five PV technologies as the first five variants, but in a horizontal configuration.
In this comparison, the dimensions and proportions of the roof and the selected PV, the number of PV modules that can be mounted, and the final power generation differ from the first five variants with vertical installation.
And more...
All four services described above—visualization, project overview, heating demand, and PV electricity generation—are included in a digital file and also available in the form of a printed notebook.
The high-quality visualization images are based on the data from the planning plans or the current building condition. For existing buildings, the visualizations are created using simple building images, integrating the PV systems to be installed into the visualization images. If necessary, visualized 3D interior shots can also be integrated into the process.
The ten variants of heating demand use ten different configurations of walls, roofs, ceilings, and windows, providing a guideline to predict which energy efficiency class the building can achieve.
In PV electricity generation, five different types of PV systems are applied to the respective roof of the building. Each PV type is implemented in two configurations, horizontal and vertical, and in each configuration, the required area and electrical output are compared. In parallel, the visual performance of each PV type is visualized and represented in the visualization images. This allows for an easy assessment of the future optical characteristics of the building as well as its electricity generation performance.
Reference Project
To illustrate, here is an example of a single-family house with a roof sloping to the south and north.